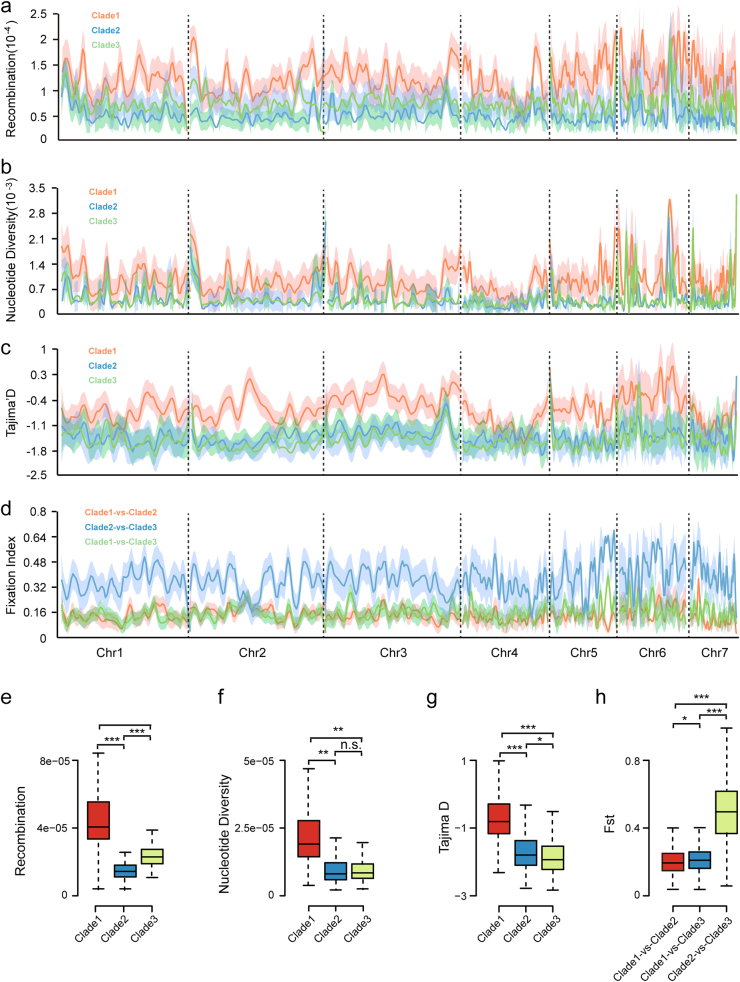
Fig. 4.
Recombination rate (ρ), nucleotide diversity (π), and Tajima’s D for the three clades of M. oryzae. a–d Whole-genome distribution of recombination rate (ρ), nucleotide diversity (π), Tajima’s D, and Fst on chromosome I ~ VII of M. oryzae with 50 kb windows. e–h Boxplot of recombination rate, Pi, Tajima’s D, and Fst values of three clades. The Tukey whiskers indicate 1.5 times the interquartile range from the 25th and 75th percentiles. n.s. represents no significance, * represents p-value smaller than 0.05, ** represents p-value smaller than 1e-5, *** represents p-value smaller than 1e-10

