Fig. 5.

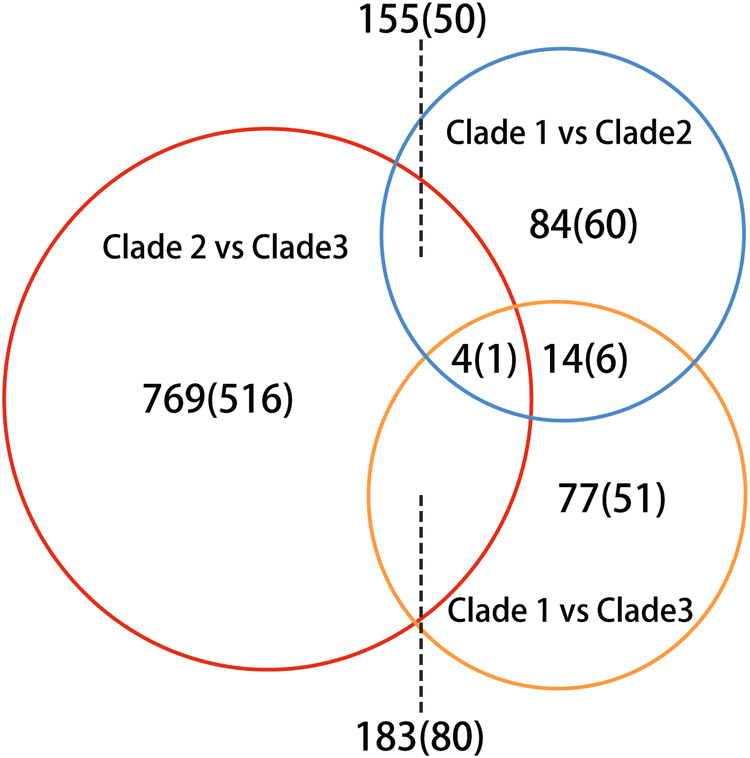
Venn diagram of genes with Fst > 0.8 in the three clades. Venn diagram depicting the pair-wise comparison of genes with Fst > 0.8 between the three clades. Numbers in brackets represent the number of genes with non-synonymous substitutions

Venn diagram of genes with Fst > 0.8 in the three clades. Venn diagram depicting the pair-wise comparison of genes with Fst > 0.8 between the three clades. Numbers in brackets represent the number of genes with non-synonymous substitutions