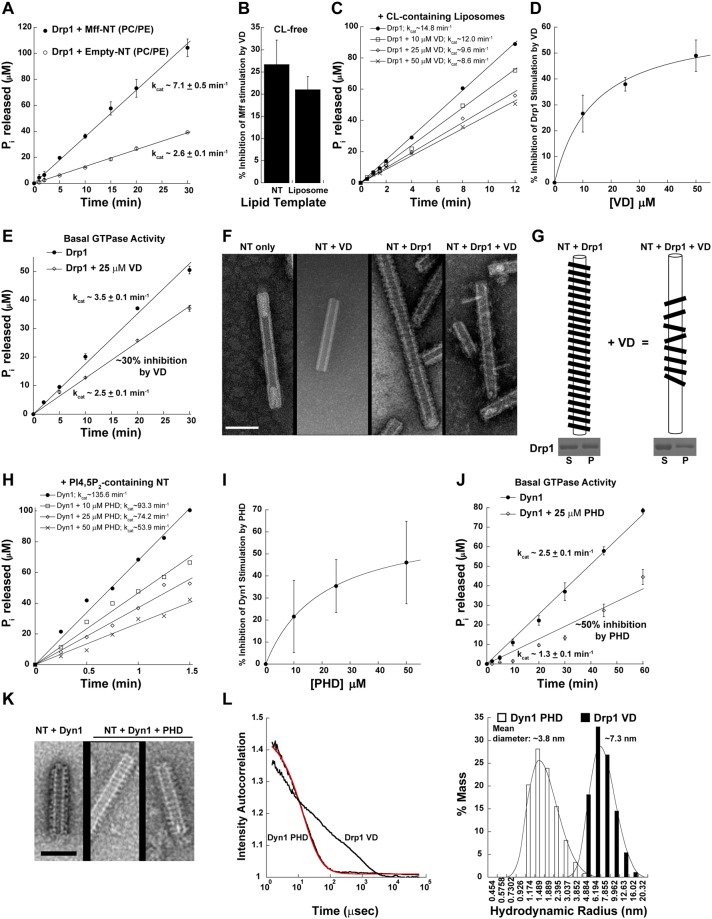
Figure 5.
Evidence for an intramolecular VD interaction site that controls G-domain dimerization. (A) Stimulated Drp1 GTPase activity on Mff-reconstituted CL-free NT relative to empty NT. (B) % inhibition of Mff-stimulated Drp1 GTPase activity on CL-free NT and liposomes in the presence of a vast molar excess (25 μM) of 6X His-tagged Drp1 VD. (C) Inhibition of CL-stimulated Drp1 GTPase activity on liposomes in the presence of increasing concentrations of 6X His-tagged VD. (D) % inhibition of CL-stimulated Drp1 GTPase activity on liposomes as a function of 6X His-tagged VD concentration. (E) Basal Drp1 GTPase activity in the absence and presence of 25 μM 6X His-tagged VD. (F) Representative EM images of 25 mol% CL-containing NT in the absence and presence of Drp1 and/or isolated VD. Scale bar, 100 nm. (G) Graphical illustration of the isolated VD-induced morphological changes in the Drp1 helical polymer. Inset below shows S and P fractions of Drp1 WT incubated with 25 mol% CL-NT in the absence (left panel) and presence of a vast molar excess of isolated Drp1 VD (right panel) obtained by high-speed centrifugation and visualized by SDS-PAGE and Coomassie staining. (H) Inhibition of PIP2-stimulated Dyn1 GTPase activity on NT in the presence of increasing concentrations of the isolated Dyn1 PH domain. (I) % inhibition of PIP2-stimulated Dyn1 GTPase activity on NT as a function of isolated Dyn1 PH domain concentration. (J) Basal Dyn1 GTPase activity in the absence and presence of 25 μM isolated Dyn1 PH domain. (K) Representative EM images of 10 mol% PIP2-containing NT incubated with Dyn1 in the absence and presence of a vast molar excess of the isolated Dyn1 PH domain. Scale bar, 100 nm. (L) (left panel) DLS intensity autocorrelation curves for the isolated, untagged Dyn1 PH domain (PHD) and the isolated, untagged Drp1 VD. Data for the Dyn1 PH domain was best fit (red trace) to a monodisperse, monomeric population. Drp1 VD data exhibited polydispersity indicative of an ensemble of conformational states for the monomeric domain. (right panel) Distribution of the hydrodynamic radii calculated from DLS measurements for the isolated Dyn1 PHD and the Drp1 VD. The mean diameter of each domain is indicated above.

