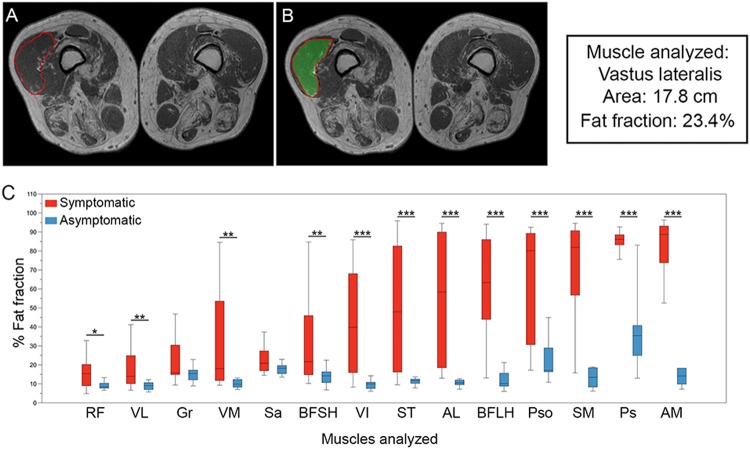
Figure 1.
Analysis of fat fraction in thigh and trunk muscles in LOPD patients at baseline. (A,B) Show an example of how ROIs are drawn to obtain total muscle area and fat fraction in 3-point Dixon images. (C) shows the fat fraction calculated for thigh and trunk muscles in symptomatic (red) and asymptomatic (blue) patients. The box plot includes the 25th–75th percentile, the mid lines indicate the median, bars are the 5th–95th percentiles. *P < 0.05, **P < 0.01 and ***P < 0.001. RF: Rectus Femoris, VL: Vastus Lateralis, Gr: Gracilis, VM: Vastus Medialis, Sa: Sartorius, BFSH: Biceps Femoris Short Head, VI: Vastus Intermedius, ST: Semitendinosus, AL: Adductor Longus, BFLH: Biceps Femoris Long Head, Pso: Psoas, SM: Semimembranosus, Ps: Paraspinalis, and AM: Adductor Major.

