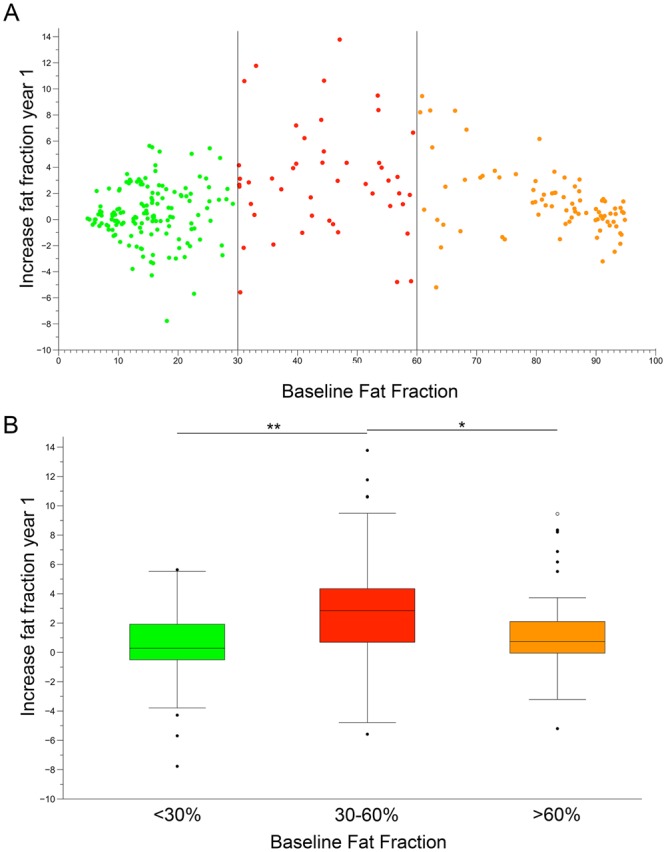
Figure 3.

Yearly progression of fat replacement in individual muscles of symptomatic patients. (A) Each dot represents fat fraction calculated in a single muscle. Vertical lines divide muscles based on baseline fat fractions: low (green dots, 0–30%), intermediate (red dots, 30–60%) and severe (orange dots, 60–90%). (B) Increase in muscle fat replacement related to baseline fat fraction. The box plot includes the 25th–75th percentile, the mid lines indicate the median, bars correspond to the 5th–95th percentiles. Black dots are outliers. Kruskal-Wallis test, *P < 0.05, **P < 0.01.
