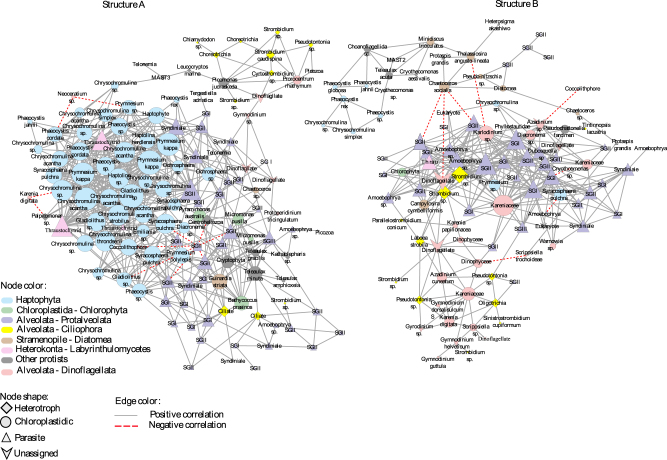
Fig. 4.
Association networks derived from the 300 most abundant protists and showing only statistically significant correlations between OTUs (Spearman correlation ≥│0.6│; p < 0.01; false discovery q < 0.05). Sub-network (a) included a total of 103 unique nodes and 348 edges (correlations) among nodes, and Sub-structural network (b) included a total of 125 unique nodes and 643 edges. Node sizes correspond to the number of neighbors (i.e., degree). Nodes colors and shapes correspond to main protist groups and their ecological behavior, respectively. Solid lines represent positive correlations and dashed lines, negative correlations

