Figure 3.
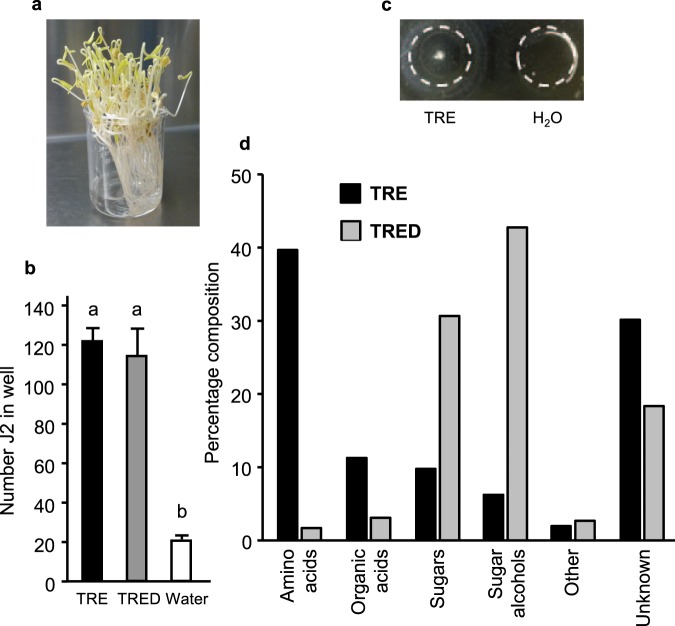
Collection and analysis of tomato root exudate (TRE). (a) TRE was collected from root tips in a 20 ml beaker. (b) Comparison of accumulation of J2 in TRE and deionized TRE (TRED)-containing wells after 6 h. Letters represent significantly different numbers of J2 (P < 0.05) according to Tukey’s multiple range test. (c) J2 aggregated into a clump in TRE-containing gel after 24 h. White dotted lines represent well boundaries. (d) Comparison of % composition of major metabolite categories in TRE and TRED.

