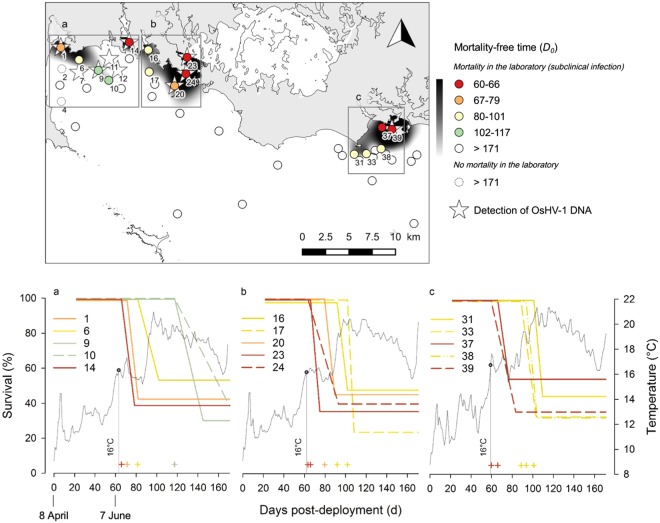
Figure 2.
Survival of sentinel oysters in the field, detection of OsHV-1 DNA and subclinical infection. Top: map of the number of days before the mortality event in the field (D0). For the sites where no mortality was observed, D0 was reported as greater than 171 d. Plain circles indicate that mortality occurred at least once in the laboratory (subclinical infection) whereas dashed circles show the two sites where no mortality occurred in the laboratory. Bottom: fitted survival curves of the sentinel oysters at the sites where a mortality event was observed (left axis). The plus signs indicate D0 values for each survival curve. Daily mean seawater temperature recorded in each zone (right axis).

