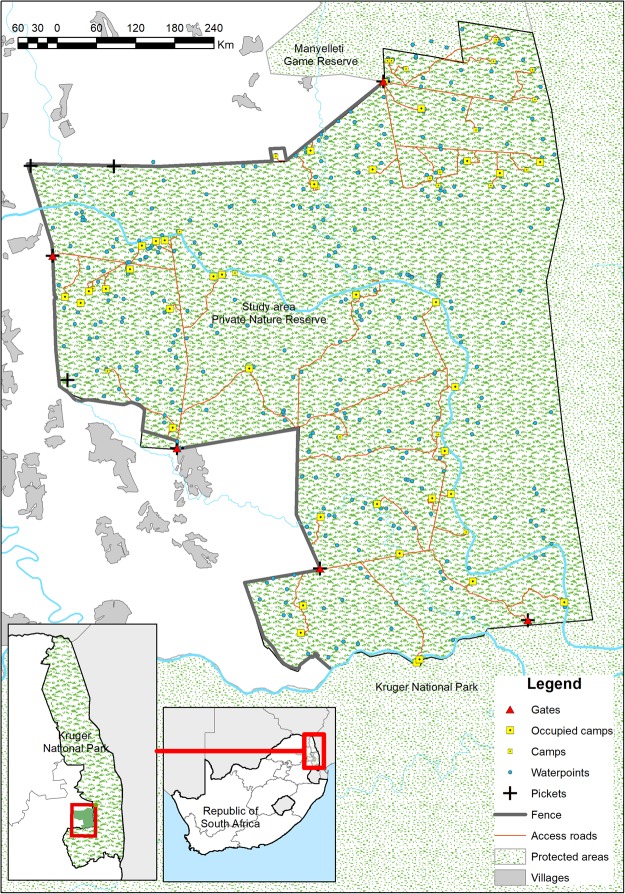
Figure 1.
Map of the study reserve indicating the locations and rabies test status of 150 dogs shot from 1 January 2009 through 18 March 2014, along with other relevant spatial features. The map was created using ESRI ArcGIS 10.3 (www.esri.com). Data on protected areas are derived from OpenStreetMap© contributors under a Creative Commons Attribution-ShareAlike 2.0 licence (CC-BY-SA; https://creativecommons.org/licenses/by-sa/2.0/) (made available under the Open Database License: http://opendatacommons.org/licenses/odbl/1.0/. Any rights in individual contents of the database are licensed under the Database Contents License: http://opendatacommons.org/licenses/dbcl/1.0/). Data on administrative boundaries were obtained from the Global Administrative Areas database22. Village outlines were digitised by the authors from 1:50,000 topographic maps 2431CA, 2431CB, 2431 CC and 2431CD from the National Geospatial Information of South Africa [Copyright Chief Directorate: National Geospatial Information. Reproduced under Government Printer’s authorisation (Authorisation No. 11793) dated 07 June 2018]. All other data layers were produced and compiled by the authors.

