Figure 6.
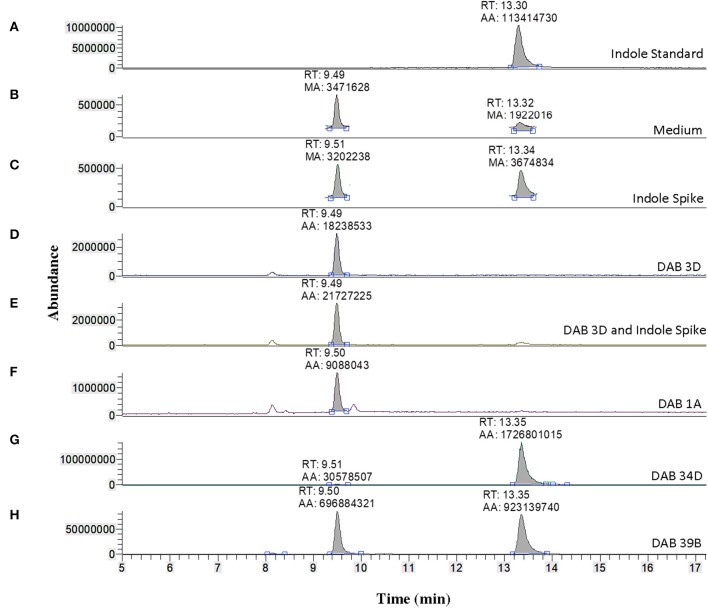
Identification of indole production in brown-type DABs by mass spectrometry. LC-MS extracted positive ionization ion chromatograms at m/z 118.06 to m/z 118.07 ([M+H] of indole). RT, retention time; AA, automatic area under peak; MA, manual area under peak. (A) EIC from an injection of 100 ng/μL free indole in 100% acetonitrile showing a retention time of 13.30 min. (B) EIC showing a low background signal at the RT of free indole in the LB medium sample. A second signal is detected at a retention time of 9.49 min in the LB medium. (C) EIC showing free indole in the LB medium spiked with 100 ng/μL of free indole. (D) EIC from the LB medium with non-color Bacillus strain, DAB 3D. (E) EIC from the LB medium with DAB 3D spiked with 100 ng/μL free indole. The indole peak area is < LoQ at the scale of the chromatogram. (F) EIC from the LB medium with pink-type Microbacterium strain DAB 1A, showing no detectable indole. (G) EIC from the LB medium with brown-type Vogesella strain DAB 34D, showing a clear indole signal. (H) EIC from the LB medium with brown-type Aeromonas strain DAB 39B, showing a clear indole signal. The scales on the Y-axis are automatically adjusted to show all the peaks in each of the chromatograms. Note the different scale on the chromatogram in (B,C) to show the lower quantity peaks.

