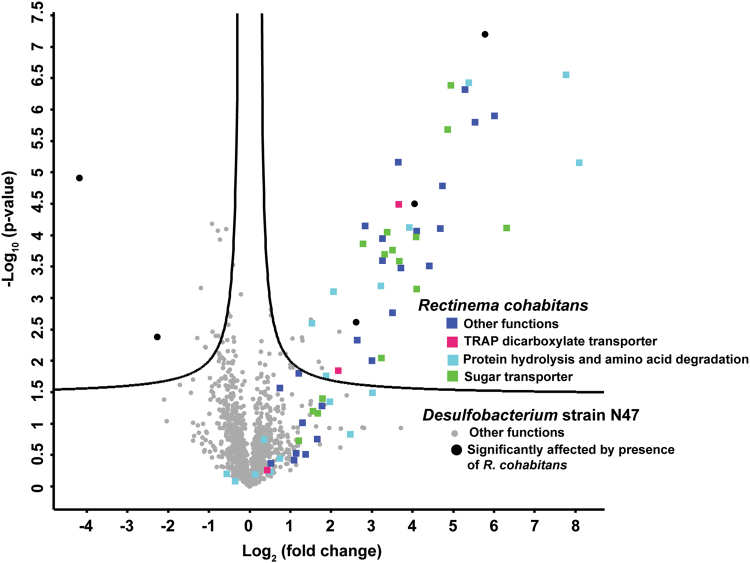
Fig. 4.
Quantitative proteomic analysis of the highly enriched Desulfobacterium culture (without R. cohabitans) and enrichment culture N47 grown in the presence of naphthalene. The volcano plot was generated using the PERSEUS software. The calculated Log2 (fold change) (x-axis) was then plotted against the corresponding p values (y-axis). Proteins to the left and above the significance line are significantly depleted in enrichment culture N47 and proteins to the right and above the significance line are significantly enriched in enrichment culture N47. The filled squares indicate proteins from R. cohabitans; the filled circles represent proteins from Desulfobacterium N47. The different colors highlight functional groups (for details see legend within figure)

