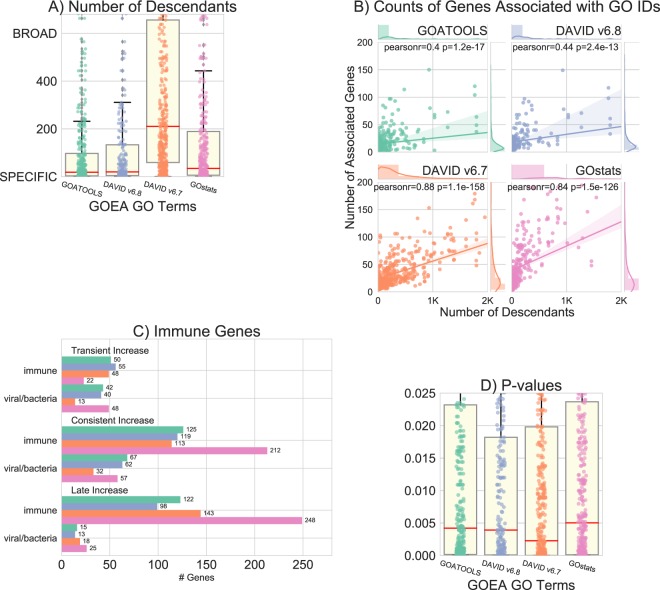
Figure 5.
Comparison between enriched terms identified by GOATOOLS, DAVID and GOstats. All panels use the the same color coding as specified in the legend in Fig. 4. (A) Number of descendants for the significant terms reported in GOATOOLS, DAVID6.7, DAVID6.8, and GOstats. GOATOOLS and DAVID6.8 both discovered GO IDs with the lowest and most similar specificity. GOstats median GO ID broadness was twice that of GOATOOLS and DAVID6.8. DAVID6.7 discovered GO IDs 10x as broad as GOATOOLS when using mean dcnt. (B) Broader GO terms are associated with more genes while specific GO terms are associated with fewer genes. All four tools show a positive correlation between descendants count and the number of genes associated with the GO term. GOATOOLS and the most recent DAVID generally discovered very specific GO IDs associated with fewer genes. DAVID6.7 and GOstats found broader GO IDs that were associated with large numbers of genes. (C) Clusters and counts of genes significant for terms related to immunity. GOATOOLS and DAVID6.8 are most similar in the types and numbers of genes discovered. GOATOOLS discovered genes significant in immune and viral/bacterial categories for all GP clusters contrasted to the DAVID6.7 which found no viral/bacteria genes for any cluster. GOstats often found more genes, but they were often associated with broad GO IDs. (D) Comparison of P-values for all of the GO terms found in total in all four tools. The mean P-values were similar for GOATOOLS, DAVID6.8, and GOstats. DAVID6.7 had P-values multitudes lower than all the other tools.

