Fig. 1.
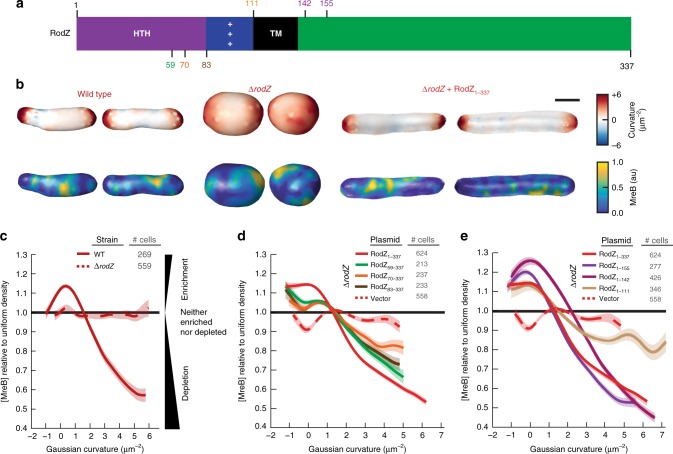
The cytoplasmic domain of RodZ is necessary for MreB curvature localization. a Schematic of RodZ’s domain structure with location of truncations noted. b 3D images of WT, ΔrodZ, and rodZ complemented cells with Guassian curvature and MreB fluorescence intensity represented. c MreB enrichment plot of WT and ΔrodZ. Values >1 show enrichment and <1 show depletion relative to uniform coverage of the cell. d MreB enrichment plot of RodZ cytoplasmic truncations. e MreB enrichment plot of RodZ periplasmic truncations. Shaded area indicates ± 1 standard error of the mean, and dotted lines indicate strains deleted of rodZ. c–e The curve for each strain is a cubic smoothing spline and is truncated using a probability threshold for extreme curvatures of p > 5 × 10⁻³ (Supplementary Figs. 4 and 5). Because the shape of each strain is different, the ranges of curvatures plotted for each strain are different. These experiments were performed on three separate days and the data were pooled

