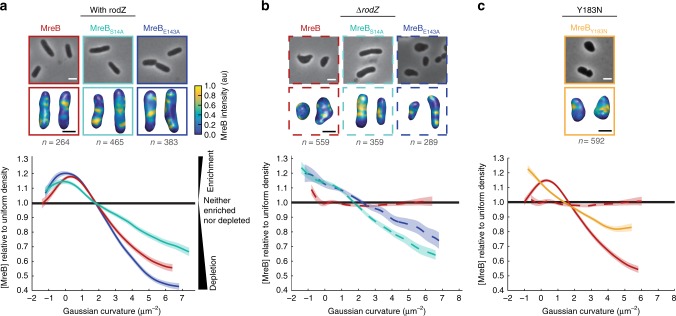
Fig. 2.
MreB curvature localization is necessary but not sufficient for rod shape determination. a MreB enrichment curves of MreB point mutants with RodZ present. b MreB enrichment curves of MreB point mutants in a rodZ deletion. c MreB enrichment curve of MreBY183N. Top images are 2D cells and bottom images are 3D cells with MreB shown according to the color intensity scale in a. The number of independent cells that contributed to the enrichment plots is indicated in gray. Shaded areas of the curves indicate ± 1 standard error of the mean and dotted lines indicate strains deleted of rodZ. The curve for each strain is a cubic smoothing spline and is truncated using a probability threshold for extreme curvatures of p > 5 × 10⁻³ (Supplementary Fig. 5). Because the shape of each strain is different, the ranges of curvatures plotted for each strain are different. These experiments were performed on three separate days and the data were pooled. White scale bar for all phase images is 2 μm and the black scale bar for all 3D reconstructions is 1 μm

