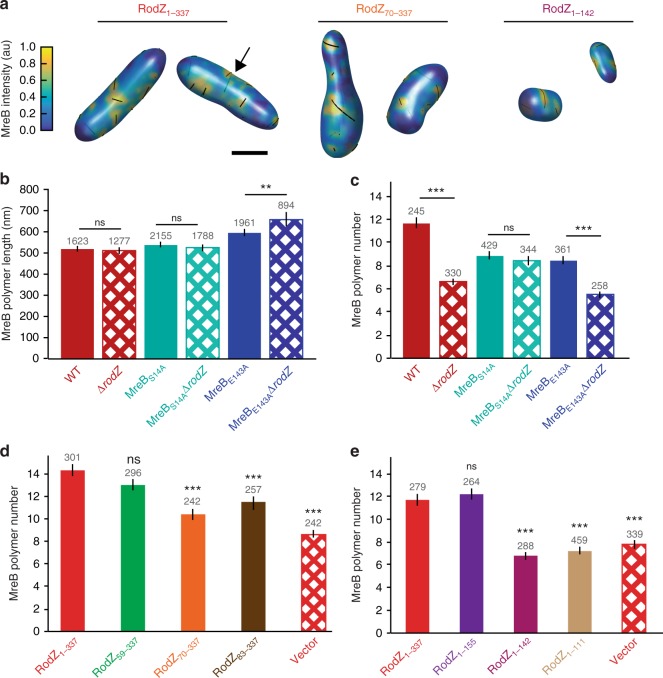
Fig. 3.
RodZ acts as an MreB assembly factor. a Semi-transparent 3D renderings of cells with full-length or truncated RodZ as indicated. MreB polymers are indicated with black lines and may be present on the back of the cell where they appear less vividly black (see example at arrow). b The average MreB polymer length (>200 nm) per cell in different MreB point mutants in the presence and absence of rodZ. c The average MreB polymer number per cell in different MreB point mutants in the presence and absence of rodZ. b, c p-value from Student’s t-test comparisons are made between strains with similar MreB point mutations. For additional cross-comparisons see Supplementary Table 3. d The average MreB polymer number per cell in RodZ cytoplasmic truncation mutants. e The average MreB polymer number per cell in RodZ periplasmic truncation mutants. b–e These experiments were performed on three separate days and the data were pooled. p-value from Student’s t-test comparisons are made between indicated strain and a strain with full length RodZ (solid red bar). For other comparisons see Supplementary Table 3. The number above the bars is the number of polymers (b) and the number of cells (c–e) analyzed. Error bars represent 95% confidence intervals. ns p > 0.05, **p ≤ 0.01, ***p ≤ 0.001

