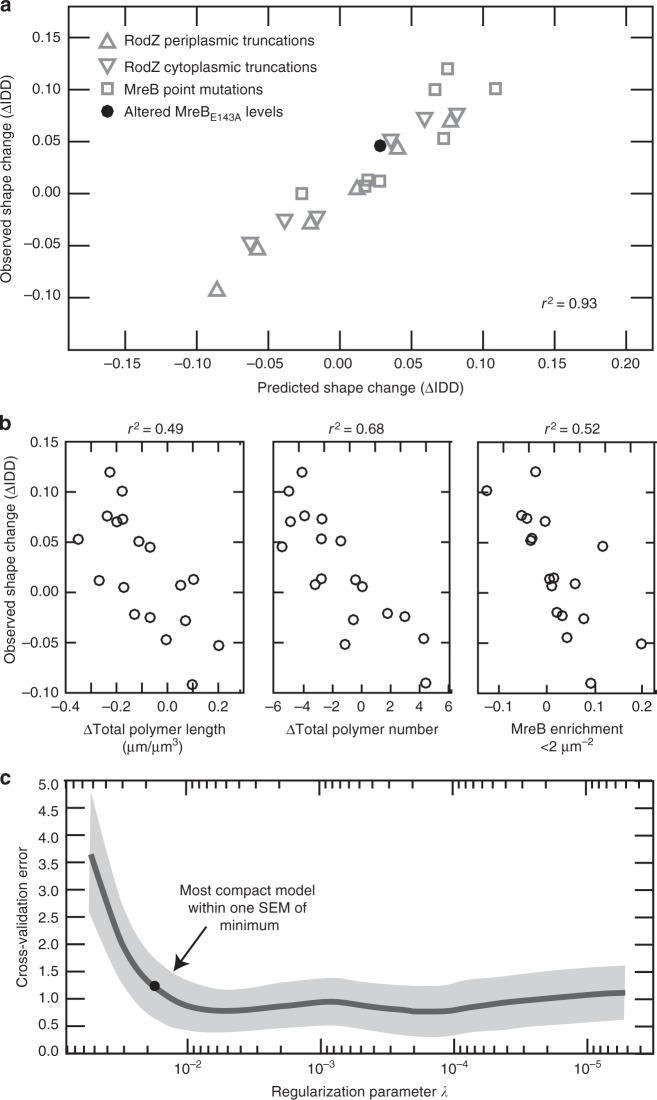
Fig. 4.
LASSO analysis reveals that rod shape requires many long and geometrically-localized MreB polymers. a The correlation between observed and predicted cell shape when using the LASSO model combining parameters. See Table 1 for all the strains used and the observed and predicted IDD values. Note that to preserve its use as a test of the model, overexpression of MreBE143A was not used for model selection and training. r2 value represents the square of the Pearson correlation coefficient. b Left—the correlation between observed and predicted cell shape when only using polymer length normalized by volume. Middle—the correlation between observed and predicted cell shape when only using polymer number. Right—the correlation between observed and predicted cell shape when only using average MreB enrichment at Gaussian curvatures below 2 μm−2. c The mean squared error (MSE) of 10-fold cross-validation as a function of the LASSO regularization parameter. The solid curve is the mean MSE and the shaded region represents one standard error of the mean. The dot represents the most compact model within one standard error of the mean from the minimum of the curve. See Supplementary Table 2 for the coefficients in this model

