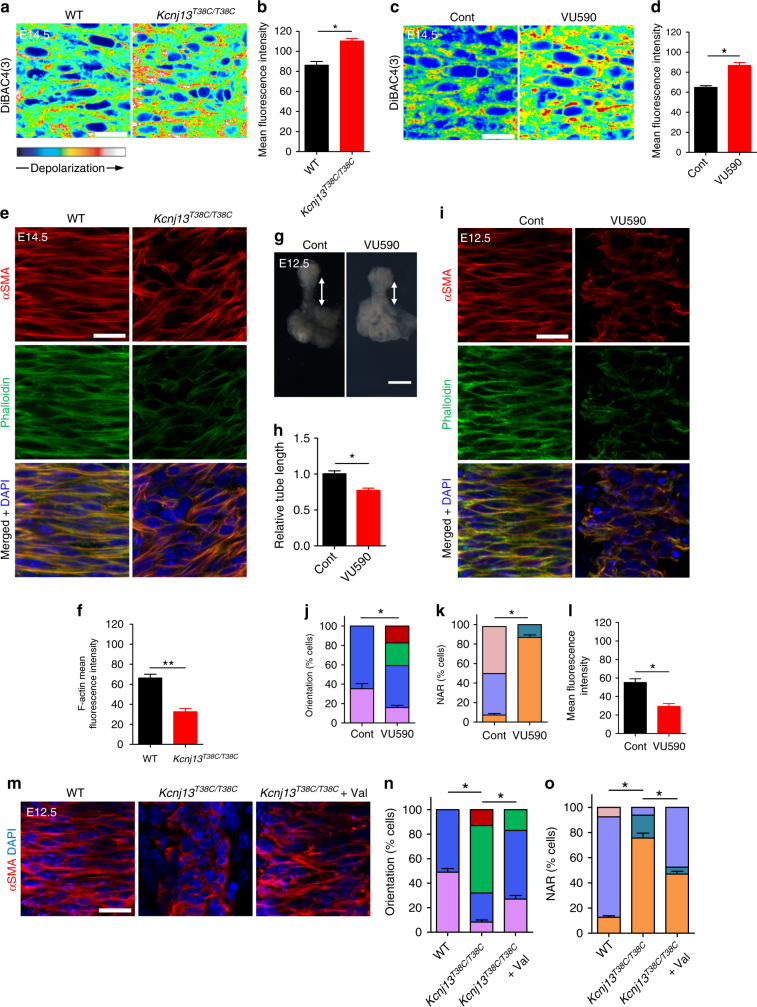
Fig. 5.
Kcnj13 regulates membrane potential and actin organization in SM cells. a DiBAC4(3) fluorescence in dorsal views of E14.5 WT (n = 9) and Kcnj13T38C/T38C (n = 9) tracheal SM cells. b Quantification of mean DiBAC4(3) fluorescence intensity in E14.5 WT (n = 9) and Kcnj13T38C/T38C (n = 9) tracheal SM cells. c DiBAC4(3) fluorescence in dorsal views of E14.5 tracheal SM cells after DMSO (n = 6) or 50 μM VU590 (n = 6) treatment. d Quantification of mean DiBAC4(3) fluorescence intensity in E14.5 tracheal SM cells after DMSO (n = 6) or 50 μM VU590 (n = 6) treatment. e Immunostaining for αSMA (red) and phalloidin (green), and DAPI (blue) staining in dorsal views of E14.5 WT (n = 8) and Kcnj13T38C/T38C (n = 8) tracheas. f Quantification of mean phalloidin fluorescence intensity in E14.5 WT (n = 8) and Kcnj13T38C/T38C (n = 8) tracheal SM cells. g Representative images of ventral views of E12.5 tracheas after a 48 h DMSO (n = 6) or 50 μM VU590 (n = 6) treatment. Double-sided arrows indicate tracheal tube length. h Quantification of relative tracheal tube length after a 48 h DMSO (n = 6) or 50 μM VU590 (n = 6) treatment. i Immunostaining for αSMA (red) and phalloidin (green), and DAPI (blue) staining in dorsal views of E12.5 tracheas after 48 h DMSO (n = 9) or 50 μM VU590 (n = 9) treatment. Quantification of E12.5 tracheal SM cell orientation (j), NAR (k), and mean phalloidin fluorescence intensity (l) after a 48 h DMSO (n = 9) or 50 μM VU590 (n = 9) treatment. m Immunostaining for αSMA (red) and DAPI staining (blue) in dorsal views of E12.5 WT (n = 24) and Kcnj13T38C/T38C (n = 12) tracheas after a 48 h DMSO treatment, and Kcnj13T38C/T38C tracheas (n = 12) after a 48 h 2 μM ionophore valinomycin treatment. Quantification of SM cell orientation (n) and NAR (o) of E12.5 WT (n = 12) and Kcnj13T38C/T38C (n = 12) tracheas after a 48 h DMSO treatment, and Kcnj13T38C/T38C tracheas (n = 12) after a 48 h 2 μM ionophore valinomycin treatment. Scale bars: 500 μm (e), 20 μm (a, c, g, i, m). *P < 0.05; **P < 0.01; unpaired Student’s t-test, mean ± s.d. Cont: control, Val: valinomycin

