
Fig. 1.
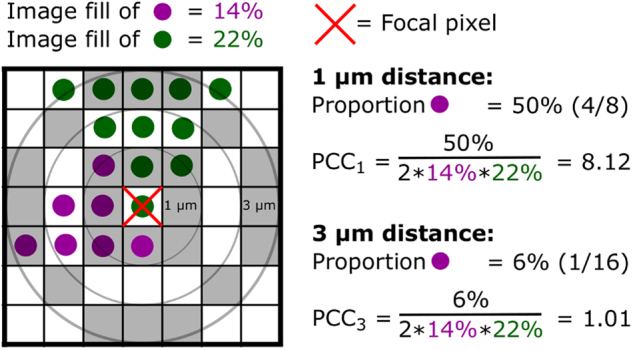
Schematic diagram of the 3D pairwise cross-correlation analysis. The diagram is shown in two dimensions, but the actual analysis is conducted in three dimensions. PCC at a certain distance is calculated as the amount of pixels that are of a different color than the focal pixel, divided by the total amount of pixels at that distance (gray zones); this proportion is then normalized to the overall image fill of the two colors, such that random positioning will give a PCC equal to one as in daime [21]. In practice, results are aggregated across many randomly chosen focal pixels, and pixels are aggregated in distance bins