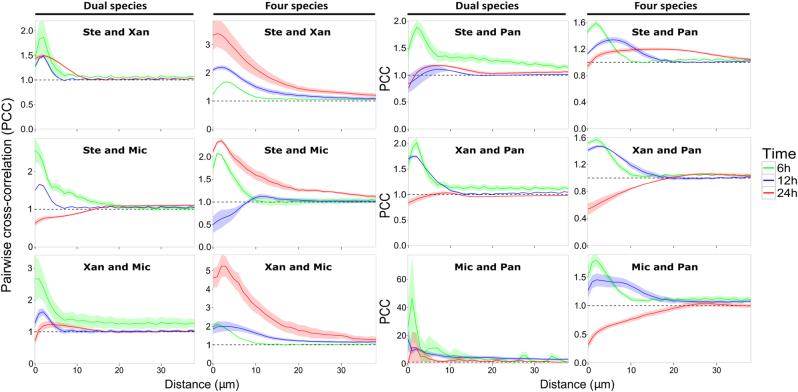
Fig. 3.
Pairwise cross-correlation analyses of dual and four-species biofilms. The mean PCC value (continuous line) and the standard error of the mean (shaded parts) are plotted against distances spaced at intervals of 1 µm. The dashed horizontal line (PCC value of 1) corresponds to random positioning. Ste; S. rhizophila, Xan; X. retroflexus, Mic; M. oxydans and Pan; P. amylolyticus. PCC values of the six species pairs were calculated from nine stacked images (three biological replicates) obtained from dual and four-species biofilms after 6 (green), 12 (blue), and 24 (red) hours of growth under flow conditions. PCC values of the 24 h four-species biofilms were calculated based on images of local regions with typical densities of M. oxydans

