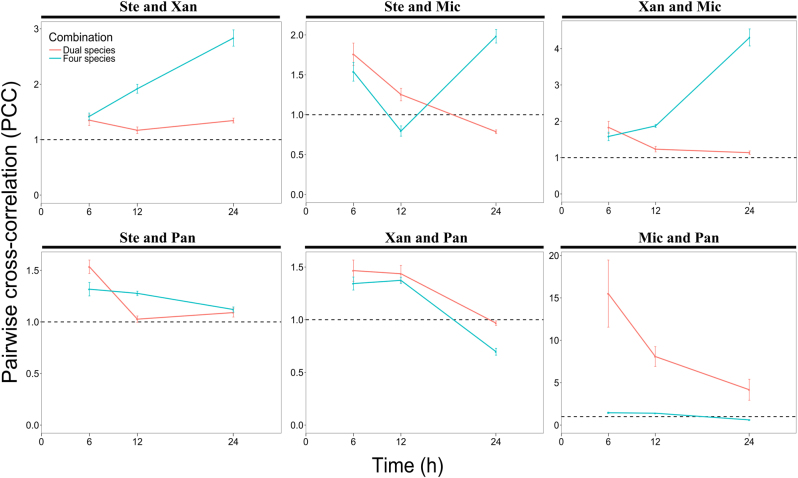
Fig. 4.
Mean of pairwise cross-correlation values of dual and four-species biofilms from 0 to 10 µm as a function of time (6, 12, and 24 h of growth under flow conditions). The red and blue solid lines represent PCC values of dual and four-species biofilms, respectively. The dashed horizontal line (PCC value of 1) corresponds to random positioning. Ste; S. rhizophila, Xan; X. retroflexus, Mic; M. oxydans and Pan; P. amylolyticus. Error bars represent standard error of the mean of the average of 10 PCC values represented in the 0–10 µm interval (n = 3)

