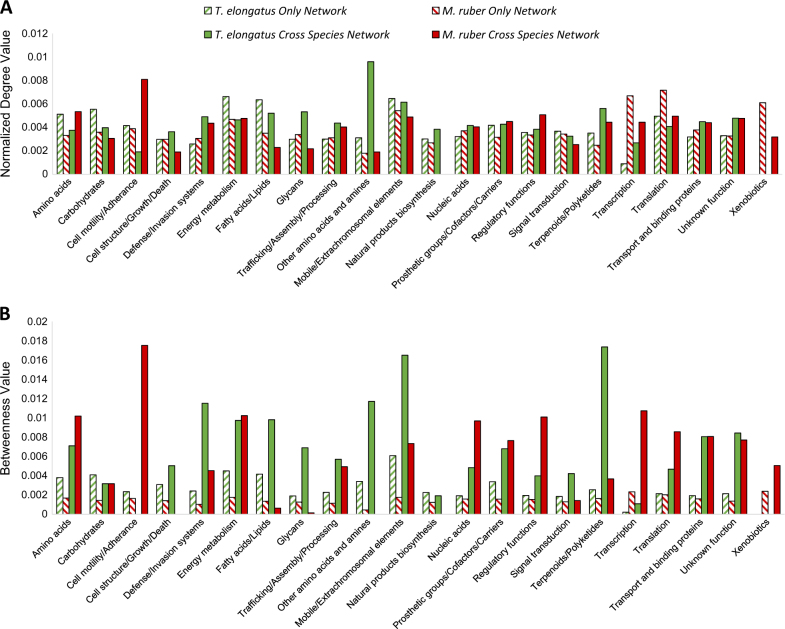
Fig. 2.
Degree values of T. elongatus and M. ruber functions. a Average normalized degree values for genes in each of the functions shown on the x-axis were calculated for a network comprised only of M. ruber genes (red hatched bars), comprised only of T. elongatus genes (hatched green bars) or for M. ruber (filled red bars) or T. elongatus (filled green bars) genes in the cross-species network. Degree values are shown on the y-axis and are normalized to the total nodes in the network. b Same as a but using betweenness as a measure of centrality rather than degree

