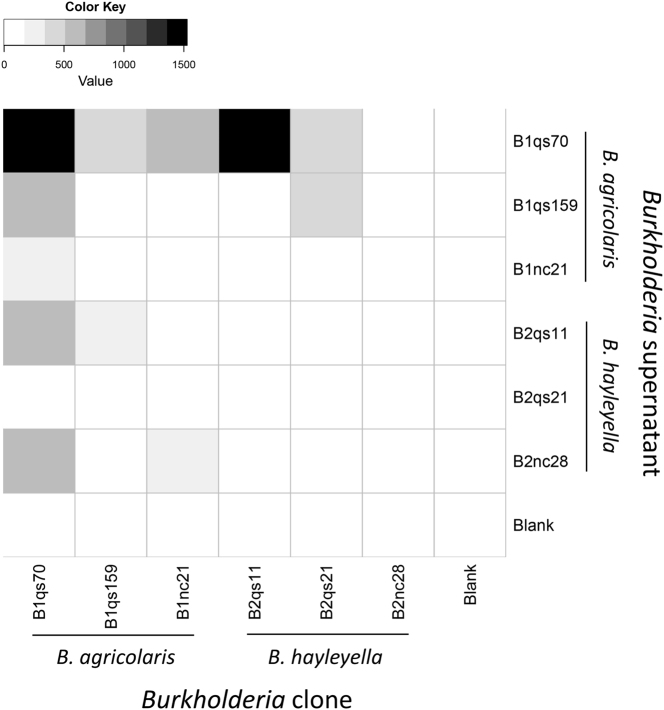
Fig. 4.
Only clone B. agricolaris B1qs70 shows much Burkholderia–Burkholderia. The figure represents a heat map of the chemotactic responses using Burkholderia supernatant or a blank control. The chemotactic responses of the carried Burkholderia are indicated by varying colour intensities according to the legend at the top of the figure. The y-axis represents Burkholderia supernatants and the x-axis represents each Burkholderia clone. The colour key represents the value of the chemotaxis index

