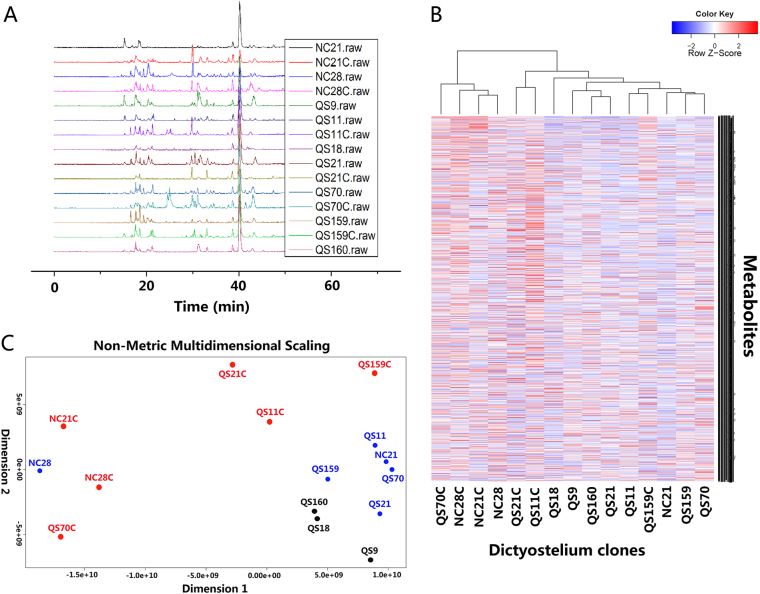
Fig. 5.
Metabolomics analysis of extracellular metabolites in supernatant of D. discoideum. Tested clones are identified by QS or NC numbers, with a trailing ‘C’ indicating that the clone was cured of its symbiont. a HPLC-MS analysis of D. discoideum extracellular metabolites. Base peak ion (BPI) chromatograms obtained from the 15 D. discoideum clones are shown. The y-axis represents relative abundance and the x-axis represents retention time. b Heat map of all identified extracellular metabolites from 15 D. discoideum clones. The abundance of each metabolite is indicated by varying colour intensities according to the legend at the top of the figure. The colour key represents the z-score, the deviation from the mean by standard deviation units. c Non-metric multidimensional scaling analysis to show the similarity of extracellular metabolites from 15 D. discoideum clones. Colours indicate different D. discoideum. Blue, farmer clones. Black, non-farmer clones. Red, cured farmer clones

