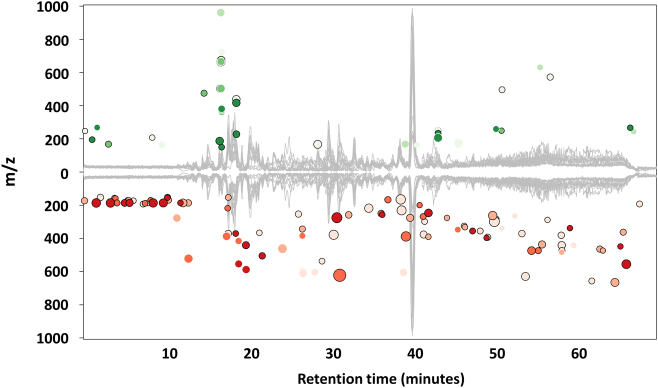
Fig. 6.
Group comparison to identify farmer specific molecules. Cloud plot of differences between farmers and non-farmers plus cured farmer of 155 features with p-value ≤ 0.01 and fold change ≥ 2. The y coordinate of each feature corresponds to the mass-to-charge ratio of the compound as determined by mass spectrometry. Features whose intensity is increased in farmers are shown on the top plot in green, whereas features whose intensity is decreased in farmers are shown on the bottom plot in red. The diameter of each bubble corresponds to the log fold change of the feature: the larger the bubble, the larger the fold change. The intensity of the feature’s colour represents the statistical significance of the fold change, where features with low p-values are brighter compared to features with high p-values

