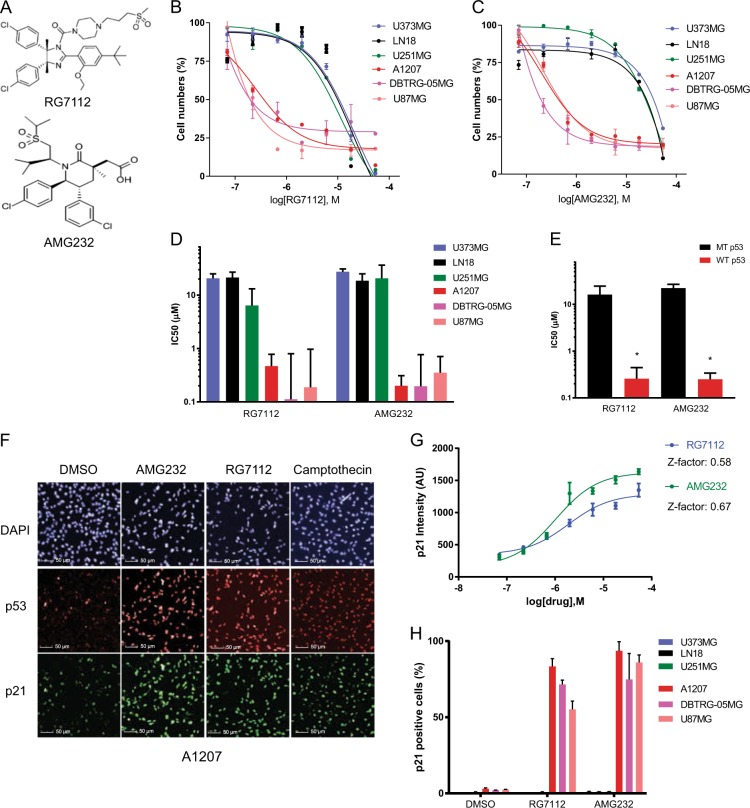
Fig. 1. The effect of MDM2 inhibitors, RG7112 and AMG232 in glioblastoma cell lines.
a Chemical structures of RG7112 and AMG232. b, c Cell numbers of U373MG, LN18, U251MG, A1207, DBTRG-05MG, and U87MG cells treated with different concentrations (0.07–54 μM) of RG7112 or AMG232 for 72 h were evaluated by quantifying image-based cell counting. Nonlinear regression analyses of dose−response curves are shown (n = 3). Error bars represent standard deviation (SD). d The IC50 values obtained from dose−response curves are shown. Each bars represent mean (n = 3) and 95% confidence interval (CI). e IC50 values of TP53 mutant cell lines (n = 3) and TP53 wild-type cell lines (n = 3) to RG7112 and AMG232 are shown. Data represent the mean and SD error (*p < 0.01). f An image-based immunofluorescence assay for p21 (green), p53 (red) and DAPI (blue) in A1207 cells treated with DMSO, RG7112 (2 μM), AMG232 (2 μM), and Camptothecin (10 μM) for 72 h are shown. g p21 fluorescence intensity measurements for A1207 cells treated with increasing concentrations of RG7112 or AMG232 for 72 h are shown. The Z-factor for 18 μM RG7112 and 18 μM AMG232 in A1207 cells are indicated. h The mean percentage of p21-positive cells (n = 3, SD) for six glioblastoma cell lines treated with DMSO, RG7112 (2 μM), AMG232 (2 μM) for 72 h are shown

