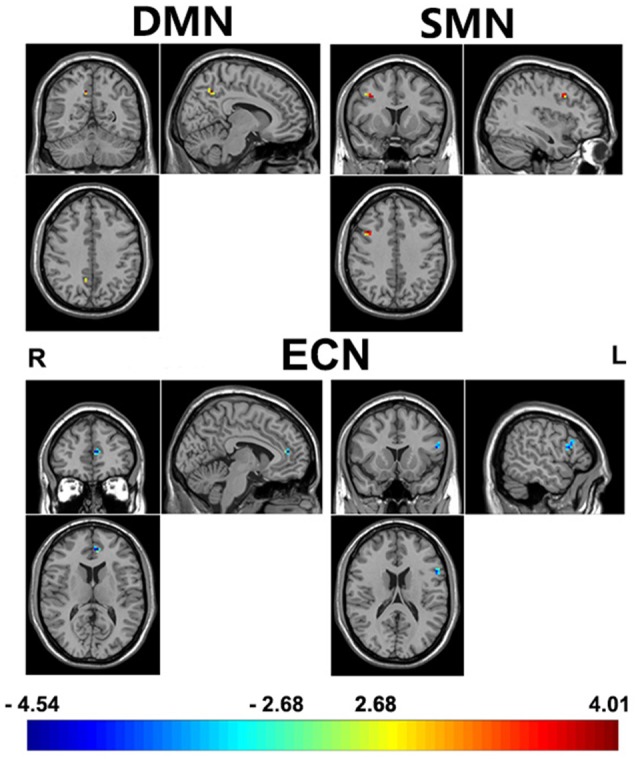
Figure 2.

A comparison of ICA results between 2-repeat absent group and 2-repeat present group. The threshold was set at a AlphaSim corrected p < 0.001. Color bar represents T-values ranging from −4.54 to 4.01. These regions are the right precuneus (9, −57, 42, MNI coordinates) in the DMN, the right middle frontal gyrus (MFG; 39, 12, 39) in the SMN, the left inferior frontal gyrus (IFG; −54, 15, 18) and the left anterior cingulate cortex (−6, 45, 12) in the ECN. DMN, default mode network; ECN, executive control network; SMN, sensorimotor network; L, left; R, right.
