Figure 2.
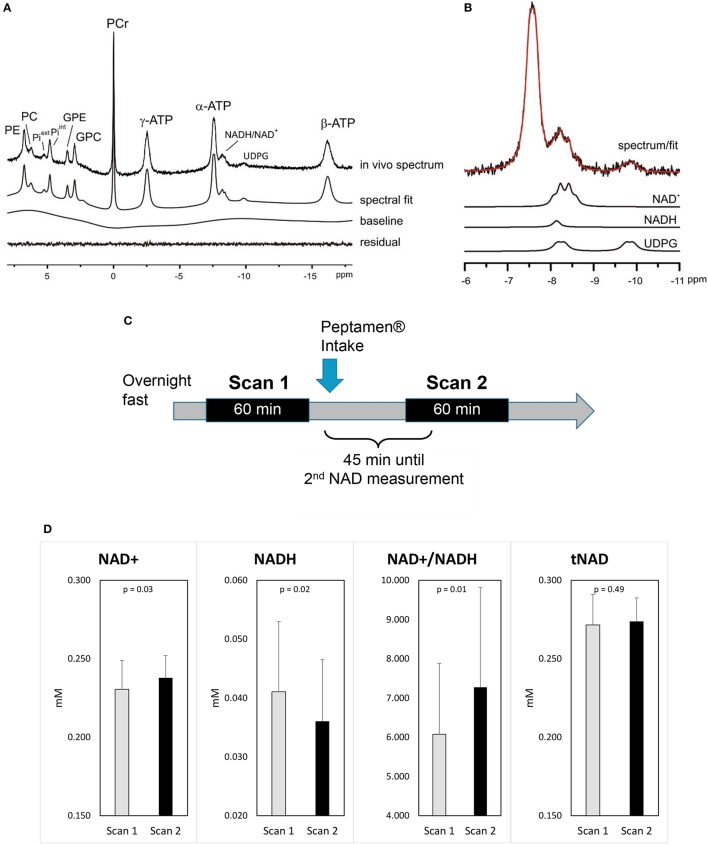
Impact of ketones on brain metabolism (A) a representative 31P MRS spectrum acquired from the occipital lobe using a surface coil (no baseline correction and no apodization were applied). LCModel fit of the in vivo spectrum (A) and (B) individual fits of NAD+, NADH, UDPG are shown. Excellent fitting quality is suggested by the minimum residual. (C) Study design. (D) Changes in brain NAD concentrations (values as mean ±standard deviation); p-values shown are derived from the mixed model.

