Fig. 1.
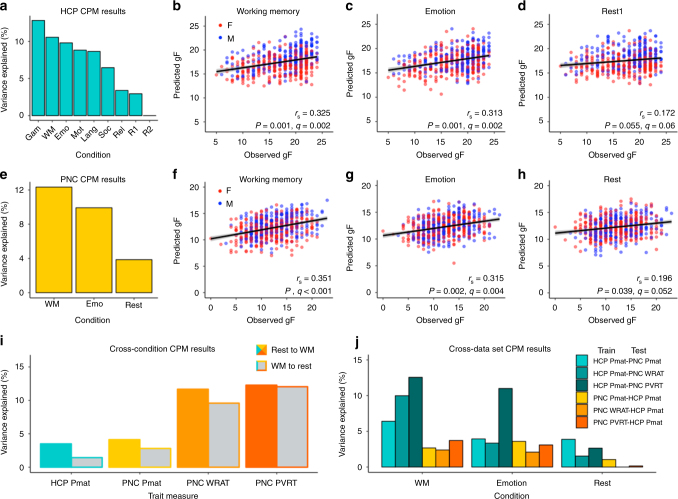
Task-induced brain state is a key determinant of individual trait prediction accuracy. a Results from the cross-validated CPM pipeline in each of the 9 HCP conditions (n = 515) using an edge-selection threshold of P < 0.001, plotted as and ordered by percent of fluid intelligence (gF) variance explained. Gam, gambling task; WM, working memory task; Emo, emotion processing task; Mot, motor task; Lang, language task; Soc, social task; Rel, relational task; R1, rest1; R2, rest2. b–d Expansion of results presented in a for the WM, emotion, and rest1 conditions; each point represents the relationship between predicted and observed gF for a single subject, colored by subject sex (F, female; M, male), plotted with the best-fit line and its 95% CI (gray area). rs, Spearman’s correlation coefficient; significance assessed via 1000 iterations of permutation testing. e–h Results of CPM analyses in the PNC data set (n = 571), presented as in (a–d). i Results of cross-condition prediction analyses; for each measure, networks built from rest data were applied to WM data (“Rest to WM”) and vice versa (“WM to rest”) to predict the corresponding measure, using an edge-selection threshold of P < 0.01. Pmat, matrix reasoning test of gF; WRAT, Wide Range Achievement Test; PVRT, Penn Verbal Reasoning Test. j Results of cross-data set validation analyses. Cool colors indicate HCP-based models; warm colors indicate PNC-based models; shade corresponds to predicted measure in the case of HCP to PNC, and to the measure used for model building in the case of PNC to HCP. In all cases, the same condition was used for model building and prediction, and an edge-selection threshold of P < 0.01 was used

