Fig. 1.
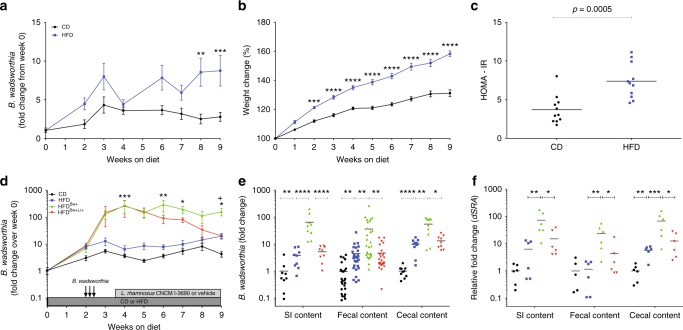
B. wadsworthia expands in HFD environment. a Fold change of B. wadsworthia in mice fed with control diet (CD) or high-fat diet (HFD) relative from day 0 (**p < 0.01, ***p < 0.001; n = 11/group). b Body weight gain (***p < 0.001, ****p < 0.0001; n = 11/group), c Homeostatic model assessment-insulin resistance (HOMA-IR) after 6 h of fasting (n = 10/group). d Fold change of B. wadsworthia relative from day 0 in mice fed with control diet (CD) or high-fat diet (HFD) and inoculated with B. wadsworthia (Bw+) and treated with L. rhamnosus CNCM I-3690 (Lr+) (*p < 0.05, **p < 0.01, ***p < 0.001 vs HFD; +p < 0.05 vs HFDBw+Lr+; n = 16–28/group). e B. wadsworthia load in small intestinal (SI), fecal and cecal contents after 9 weeks of CD or HFD. f Expression of the dsra gene in the small intestinal (SI), fecal and cecal contents after 9 weeks of CD or HFD (*p < 0.05, **p < 0.01, ***p < 0.001, ****p < 0.0001). Statistical comparison was performed by first testing normality using Kolmogorov–Smirnov test, then t-test with Welch correction or Mann–Whitney non-parametric test for two groups, or ANOVA or Kruskal–Wallis test with Bonferroni or Dunn’s post hoc test for more than three groups. Error bars represents SEM

