Fig. 2.
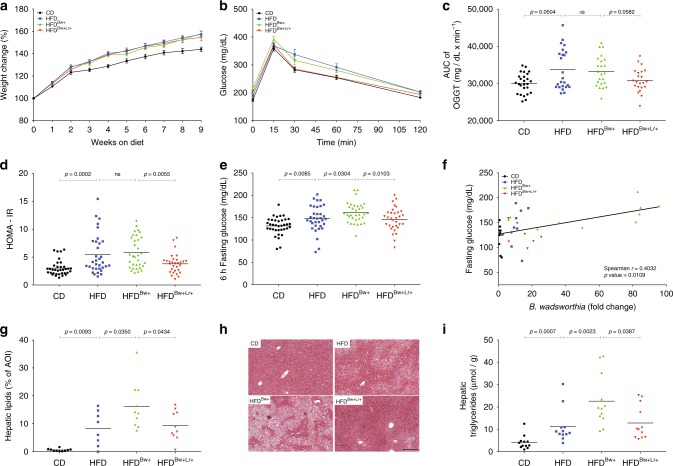
B. wadsworthia synergizes with HFD to trigger a stronger metabolic impairments. a Body weight gain (n = 37–40/group). b Blood glucose level before and after oral glucose tolerance challenge (OGTT; 2 g/kg mouse; n = 27–40/group). c Area under the curve (AUC) of OGTT. d homeostatic model assessment-insulin resistance (HOMA-IR) after 6 h of fasting. e Blood glucose after 6 h of fasting. f Spearman correlation of fasting glucose and B. wadsworthia load in the cecal content. g Lipid area, calculated as % area of interest (AOI), in liver cross-sections stained with H&E. h Representative pictures of liver stained with H&E. Scale bar = 100 µm. i Liver triglycerides after 6 h of food deprivation. Statistical comparison was performed by first testing normality using Kolmogorov–Smirnov test and then ANOVA or Kruskal–Wallis test with Bonferroni or Dunn’s post hoc test. Error bars represents SEM

