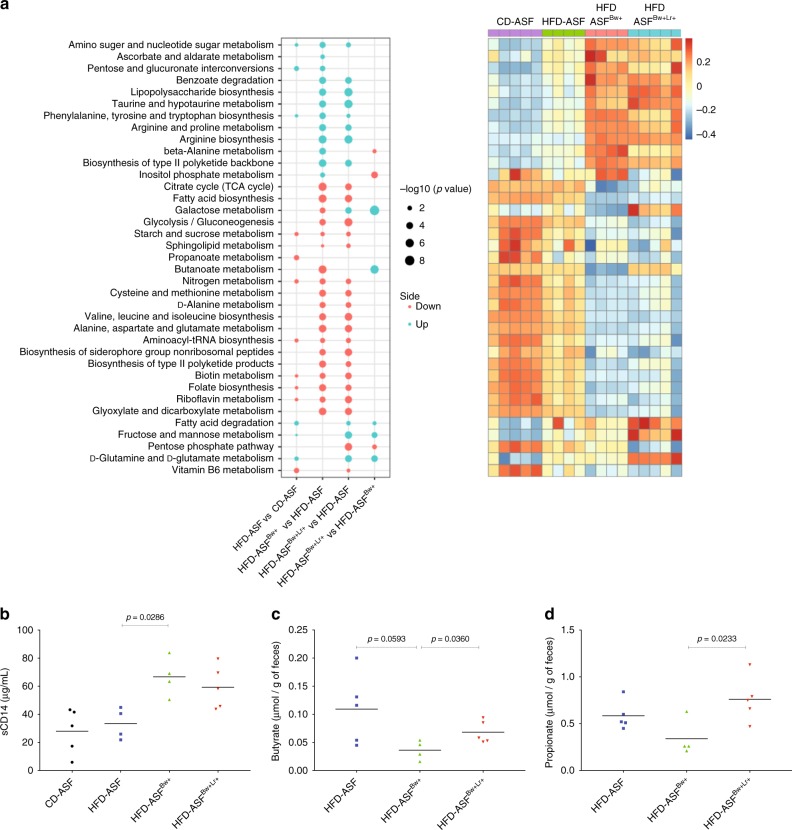
Fig. 5.
The presence of B. wadsworthia and L. rhamnosus CNCM I-3690 induces changes in microbiota metatranscriptomics. a Left: Bubble plot of -log10(BH p-values) of a selection of significant pathway activities between indicated groups (Blue: up regulated in first compared to second group. Red: down regulated in first compared to second group); right: Heatmap of corresponding pathway activity. b Concentration of soluble CD14 in serum. c Butyrate and d propionate concentrations in the feces. Statistical comparison was performed by first testing normality using Kolmogorov–Smirnov test and then ANOVA or Kruskal–Wallis test with Bonferroni or Dunn’s post hoc test. Error bars represents SEM

