Fig. 4.
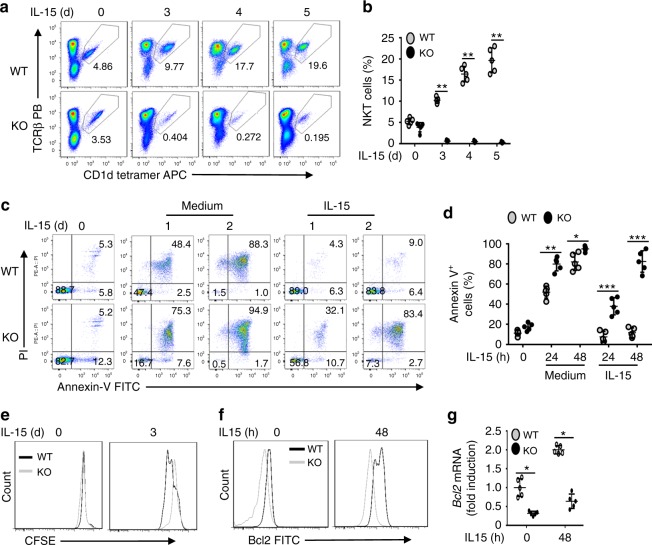
Tbkbp1 mediates IL-15-stimulated NKT cell survival. a, b Flow cytometric analysis of NKT cell frequency in NKT-enriched WT and Tbkbp1-KO thymocytes (CD8+ cells depleted by microbeads) after in vitro incubation with IL-15 for the indicated time periods. Data are presented as a representative plot (a) and summary graph (b). c, d Flow cytometry analysis of apoptotic cells (based on AnnexinV and PI staining) in enriched thymic NKT cells cultured for indicated time periods with IL-15 or medium control. Data are presented as a representative plot (c) and summary graph (d). e Proliferation assays (based on CFSE dilution) of WT or Tbkbp1-KO thymic NKT cells labeled with CFSE and cultured for the indicated time with IL-15. f, g Flow cytometric analysis of intracellular Bcl-2 level (f) and qRT-PCR analysis of Bcl2 mRNA (g) in WT or Tbkbp1-KO thymic NKT cells, either freshly isolated or cultured with IL-15 for 48 h, presented as a representative plot (left) and summary graph (right). All summary graphs are presented as mean ± s.d. values based on 5 WT and 5 Tbkbp1-KO mice. The similar data were obtained from at least three independent experiments. *P < 0.05; **P < 0.01; ***P < 0.001. Mann–Whitney test (b), Student’s t-test (d, g)

