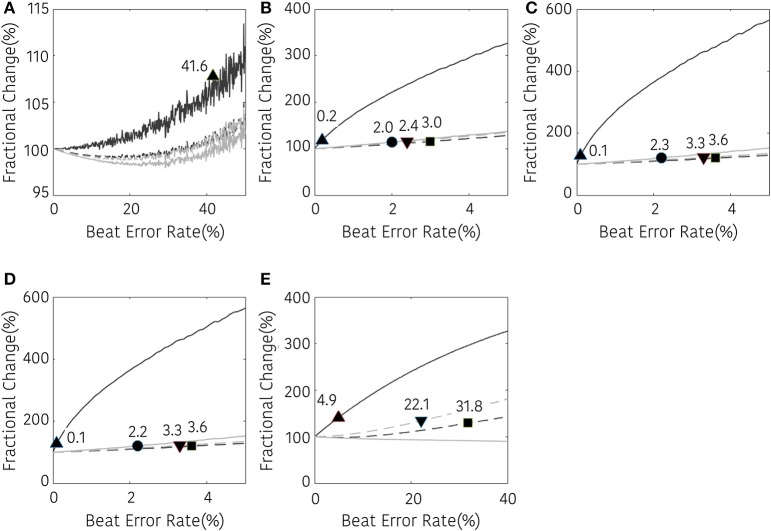
Figure 5.
Result of time-domain HRV analysis according the beat error rate. The number in the figure represents the beat error rate that begins with a significant difference. The dark solid line, bright solid line, dark dashed line, and bright dashed line indicate non-interpolated, NNI, LI, and CSI, respectively. (A) AVNN, (B) SDNN, (C) SDSD, (D) RMSSD, (E) pNN50. Markers (▴, •, ■, ▾) represent the position of the error rates that start to have a statistically significant difference compared to the HRV variable derived with ectopic-free IBIs.

