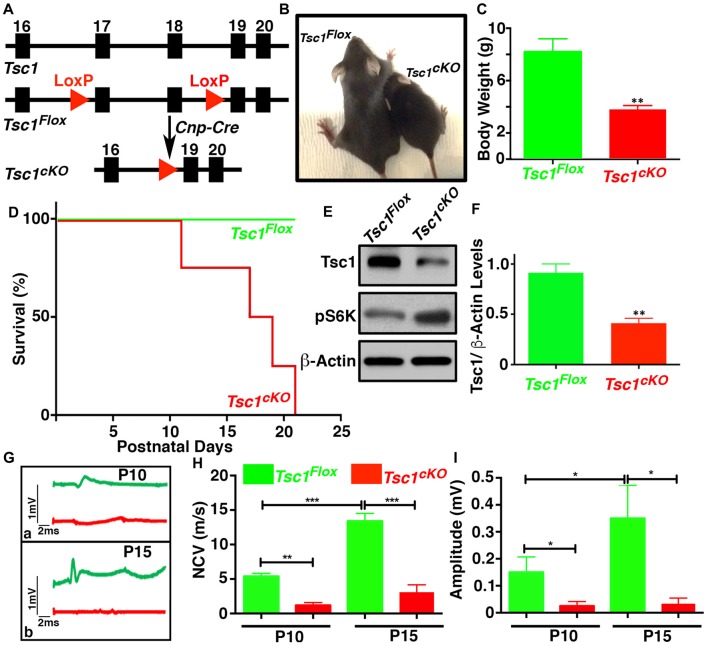
Figure 1.
Ablation of Tsc1 in myelinating glia results in motor disability and decline in peripheral nerve conduction properties. (A) Schematic diagram showing the partial genomic map of the Tsc1 locus. Tsc1 exons 17 and 18 are flanked by LoxP sites which allow Cre-mediated excision of the floxed axons. (B) Photographs of control (Tsc1Flox) and Cnp-Cre;Tsc1Flox (Tsc1cKO) mice at P10. (C) Body weight measurement of Tsc1Flox (green bar) and Tsc1cKO (red bar) mice at P10. n = 5, comparisons between genotypes were performed by Student t-test. **p < 0.01. (D) Survival curve of Tsc1Flox and Tsc1cKO mice. n = 5 in each group. (E) Expression of Tsc1 and pS6K in the spinal cords (SCs) of Tsc1Flox and Tsc1cKO mice at P15 examined by western blot analysis. β-actin was used as a loading control. n = 5. (F) Quantification of intensities of Tsc1 levels measured by ImageJ software (NIH). Comparisons between genotypes were performed with Student t-test. n = 5, **p < 0.01. (G–I) Representative electrophysiological profiles of CAPs from sciatic nerves are shown in (G). Quantification of nerve conduction velocity (NCV) (H) and amplitude (I), respectively, from sciatic nerves of P10 and P15, Tsc1Flox and Tsc1cKO mice. n = 5, comparisons between genotypes or between different ages within the same genotypes were performed by two-way ANOVA with Tukey Statistical post-test *p < 0.05, **p < 0.01 or ***p < 0.001.

