Figure 6.
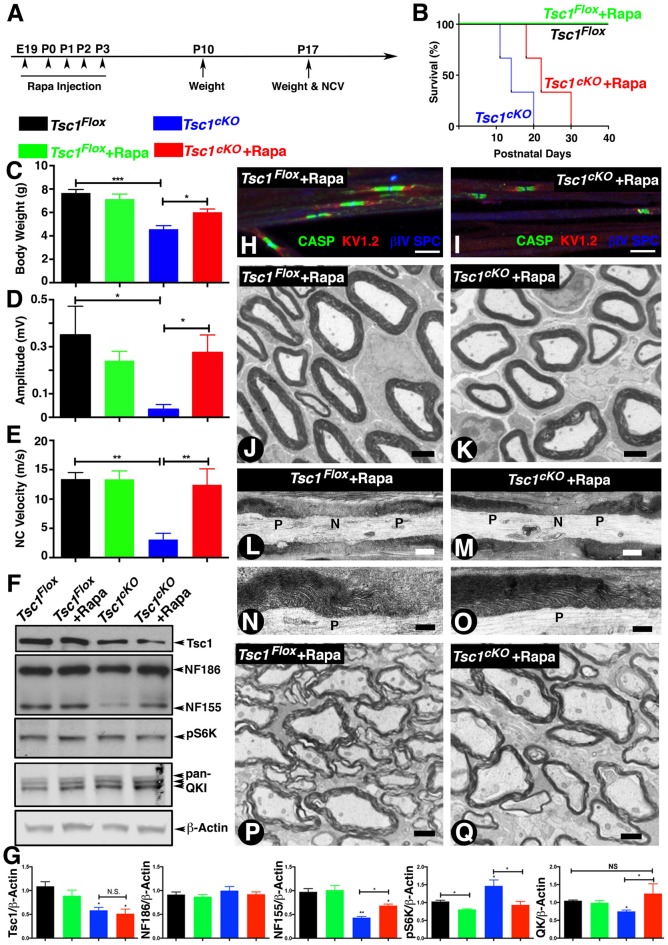
Inhibition of mTORC1 by Rapamycin in the absence of Tsc1 rescues nerve conduction, myelination and paranodal organization. (A)Timeline of Rapamycin administration (E19 to P3), weight measurements and end time points for experiments. n = 5 in each group. (B) Survival curve of Tsc1Flox and Tsc1cKO mice treated with Rapamycin (green and red), compared to mice without Rapamycin treatment (black and blue). n = 5 in each group. (C–E) Body weight measurement (C), NCV (D,E) amplitude measurement of all four types of experimental group mice, Tsc1Flox and Tsc1cKO, Tsc1Flox and Tsc1cKO treated with Rapamycin. n = 5 in each group. (F) Western blot analysis of SC from all four types of experimental groups with antibodies against Tsc1, NF-CT, pS6K and pan-QK. (G) Quantification of immunoblots shown in (F). β-Actin served as loading control. n = 3 in each group. (H,I) Immunostaining of teased SN fibers from control (H) and Tsc1cKO mutant mice (I) both receiving Rapamycin, with antibodies again Contactin-associated protein 1 (Caspr1; CASP, green), Kv1.2 potassium channel (red) and nodal βIV Spectrin (blue). (J,K) TEM images of cross sections from sciatic nerve of P15 Tsc1Flox (J) and Tsc1cKO (K) mice, both receiving Rapamycin. (L–O) TEM images of longitudinal sections of sciatic nerves from P15 control (L,N) and Tsc1cKO Rapamycin-treated mice (M,O). n = 3 in each group. (P,Q) TEM image of cross sections from SCs of P15 Tsc1Flox (P) and Tsc1cKO (Q) Rapamycin-treated mice. n = 3 in each group. Scale bars: (G,H) = 6 μm; (I,J) = 2 μm; (K,L,O,P) = 1 μm; (M,N) = 0.4 μm, *p < 0.05, **p < 0.01 or ***p < 0.001.

