
FIGURE 10.
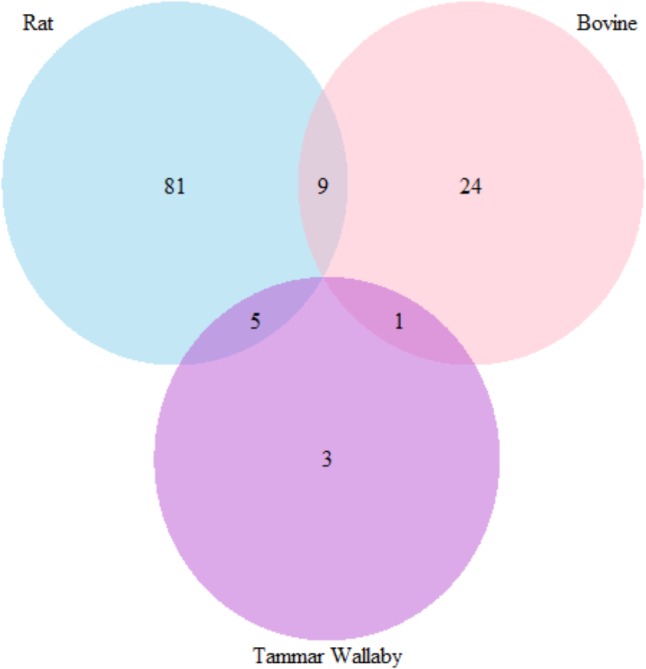
Venn diagram representing the number of genes that were selected by more than three attribute weighting model in three species to differ in lactation process.
Official websites use .gov
A
.gov website belongs to an official
government organization in the United States.
Secure .gov websites use HTTPS
A lock (
) or https:// means you've safely
connected to the .gov website. Share sensitive
information only on official, secure websites.
Venn diagram representing the number of genes that were selected by more than three attribute weighting model in three species to differ in lactation process.