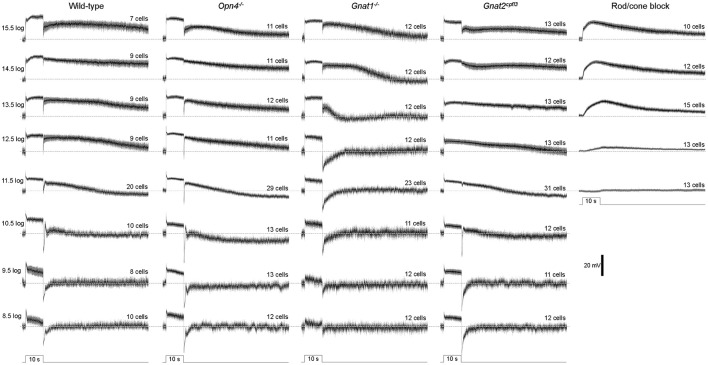
Figure 2.
Light-step responses averaged from all cells tested. The black traces represent the mean values, and the surrounding gray areas denote S.E.M. The horizontal dashed lines mark the prestimulus baselines. N values are stated above each trace. The cells recorded during rod/cone signaling block included wild-type, Gnat1−/− and Gnat2cpfl3 cells.

