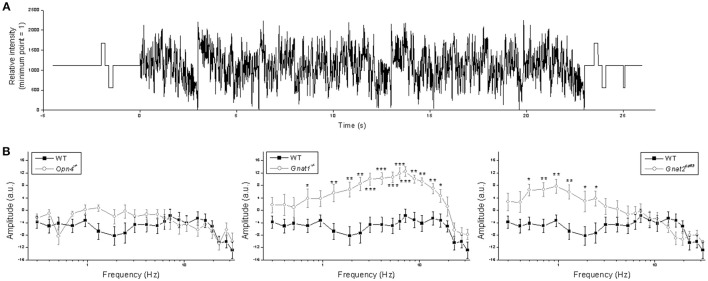
Figure 8.
Responses to the sum-of-sinusoids stimulus. (A) The sum-of-sinusoids stimulus. (B) Frequency-specific response amplitude comparisons between the wild-type cells (black squares) and the other genotypes (open circles). N values were 15 cells for wild type, 10 cells for Opn4−/−, 9 cells for Gnat1−/−, and 9 cells for Gnat2cpfl3. *p < 0.05, **p < 0.01, ***p < 0.001.

