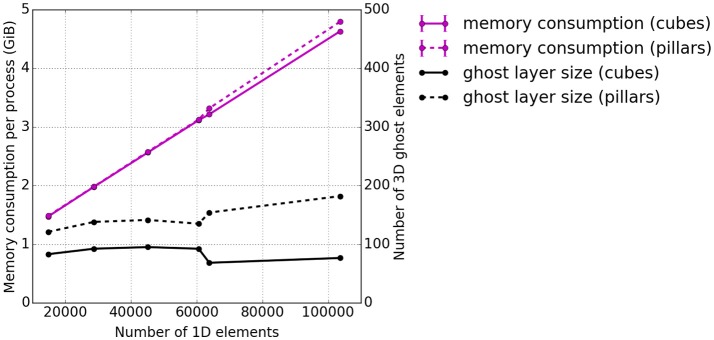
Figure 10.
Weak scaling measurements—experiment #3: Total memory consumption per process at the end of the runtime. The total memory consumption is depicted in magenta and the average number of 3D ghost layer elements per process in black. Again, the solid lines represent cuboid partitioning and the dashed line piller-like partitioning.

