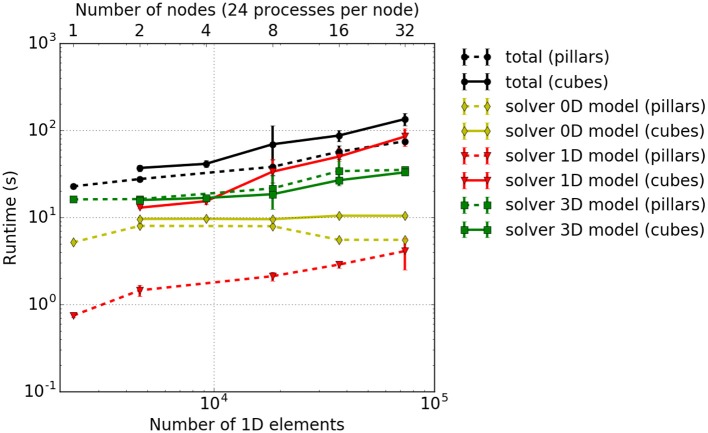
Figure 8.
Weak scaling measurements–experiment #2: Total runtime as well as individual runtimes (solver for the 0D, 1D, and 3D problem) for the cuboid partitioning (solid lines) and pillar-like partitions (dashed lines). The error bars indicate estimated standard deviation of runtimes on all involved processes of a single simulation run.

