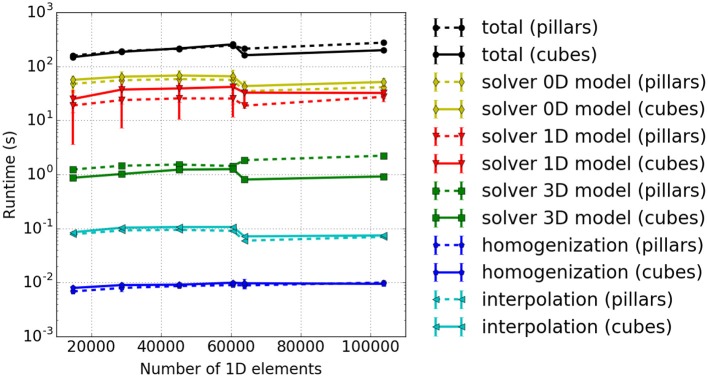
Figure 9.
Weak scaling measurements—experiment #3: Runtimes for different model components. The results for cuboid and pillar-like partitions are depicted by solid and dashed lines, respectively. Different runtime components are encoded in colors, i. e., the total runtime in black, 0D solver in yellow, the 1D solver in red, the 3D solver in green, the interpolation in light blue and the homogenization in dark blue.

