
Figure 3.
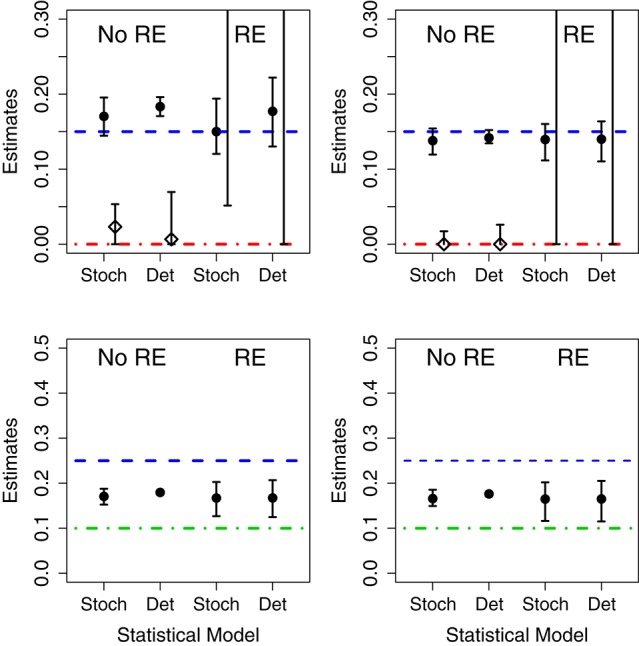
Results of fits when using mismatched structural models. The symbols correspond to the estimates of the growth rate (circles) and death rates (diamonds) under different scenarios. In the (Left), the data was generated without parametric variability and in the (Right) the data was generated with parametric variability. Top row: results of fits with a birth-death model to data generated by a pure birth process. In each case, we used stochastic or deterministic fits, without (“No RE”) or with (“RE”) random effects. The horizontal dashed blue lines indicate the value μA (birth rate) and the dot-dashed red line the value of σA used in the data generation. Bottom row: results of fits with a pure birth model to data generated by a birth-death process. The horizontal dashed blue lines stand for μA and the dot-dashed green lines for μB. In all cases, the vertical whiskers are the 95% CI obtained in the fits. Note that the estimates of the death rate for the random effects fits (in the top panel) are off the plot, and only the bottom segments of the whiskers are visible).