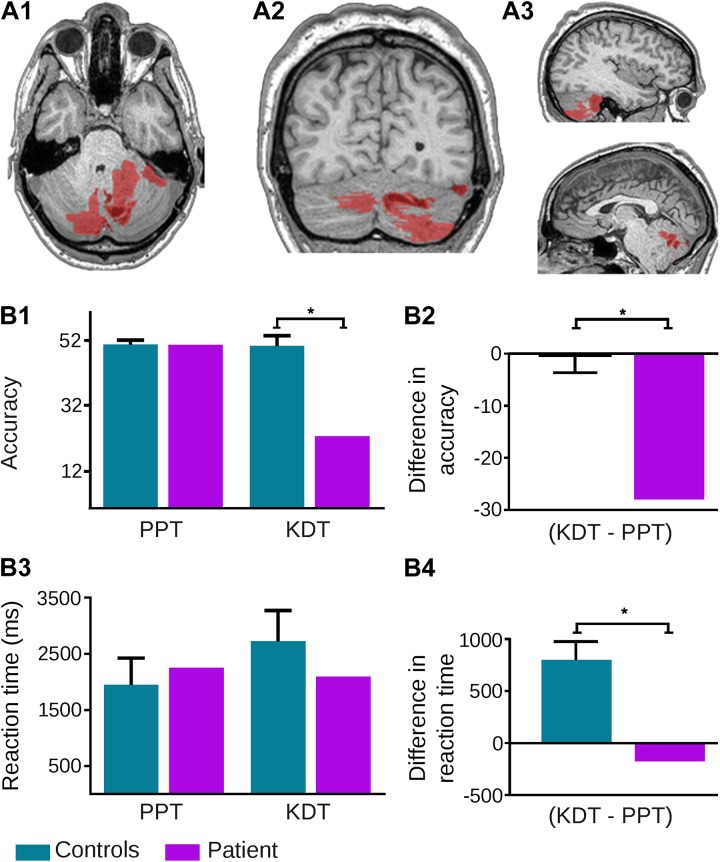
FIGURE 1.
Neuroanatomical and behavioral evidence from patient NA. (A) Extent of the tumor highlighted in red on the original T1 MRI scan of the patient’s brain: (A1) axial view; (A2) coronal view; (A3) sagittal section – right (up) left (down). (B) Behavioral performance of patient and controls on the Pyramids and Palm Trees (PPT) test and the Kissing and Dancing Test (KDT). (B1) The patient showed significantly reduced accuracy on the KDT (p < 0.001) but not on the PPT test (p = 0.93). The patient’s deficit on the KDT remained after covarying for global scores on the Montreal Cognitive Assessment (MoCA), the INECO Frontal Screening (IFS) battery, and the State version of the State Trait Anxiety Inventory (STAI-S) – all p-values < 0.001. (B2) Subtraction of PPT from KDT accuracy scores in each subject showed a difference of 28 answers for the patient and an average difference of –0.3 in controls; this difference was significant (p = 0.001) and it remained so after covarying for MoCA (p = 0.005), IFS (p = 0.01), and STAI-S (p = 0.004) scores. (B3) Reaction times for the patient were similar to those of controls on both the PPT test (p = 0.59) and the KDT (p = 0.32). (B4) However, subtraction of reaction times on the PPT test from those of the KDT in each subject revealed notably longer latencies (∼800 ms more) for the latter in controls, and virtually null differences in the patient; such a difference between the patient and controls was significant (p = 0.005) and it remained so after covarying for MoCA (p < 0.001), IFS (p = 0.01), and STAI-S (p = 0.004) scores. The asterisk (∗) indicates significant differences.

