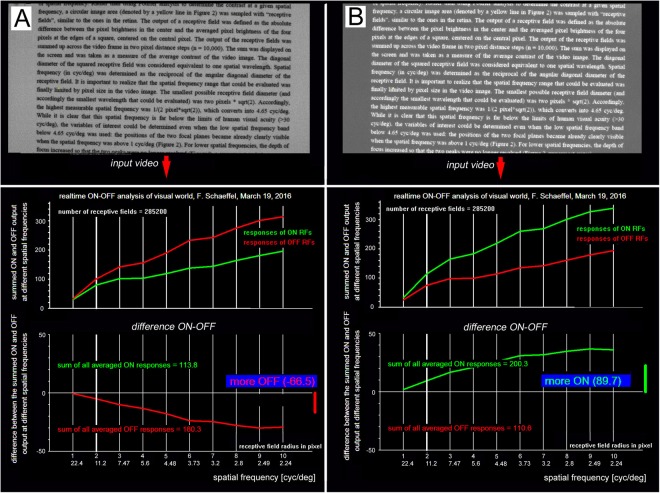
Figure 1.
Analysis of the relative strength of ON and OFF stimulation when looking at (A) dark text on bright background or (B) bright text on dark background. The average luminance of both pictures was matched (top). On the bottom, the output of the software is shown. Green lines indicate the relative strength of ON stimulation, red lines of OFF stimulation, plotted over a range of spatial frequencies (from 22.4 to 2.24 cyc/deg when measured with a 16 mm camera lens). Note that dark text on bright background always overstimulates OFF pathways while bright text on dark overstimulates ON pathways.

