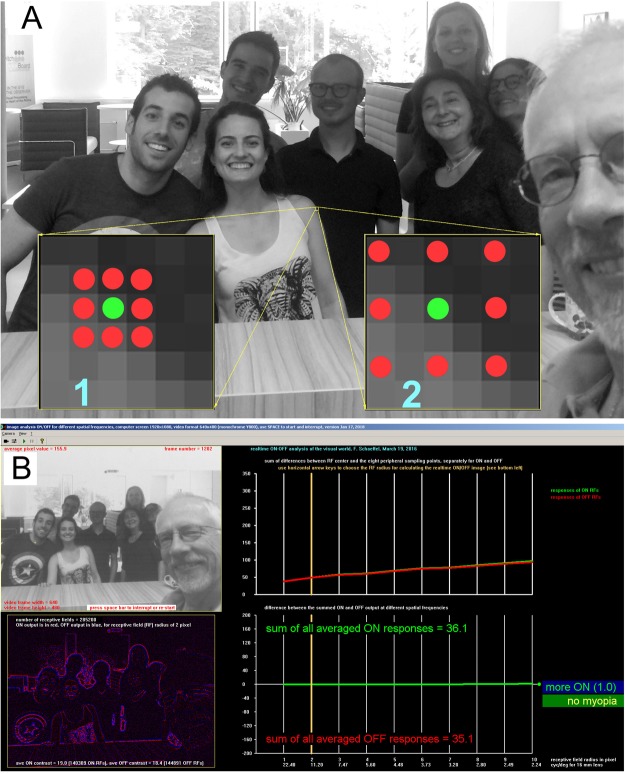
Figure 3.
(A) Procedure to determine the relative ON and OFF input strength in a scene. Software scanned the video with 285,200 “receptive fields” spaced at regular intervals across the picture. Receptive fields had a simple structure as illustrated by the arrays of green and red dots. The average gray level of 8 peripheral pixels (red) was subtracted from the grey level of the center pixel (green). If the result was positive, the position in the image was considered ON stimulating, if negative, OFF stimulating. The analysis was done simultaneously for different receptive field sizes, and accordingly at different spatial frequencies. The highest sampled spatial frequency by receptive field “1” was about 22.4 cyc/deg with a 16 mm camera lens. Receptive field “2” sampled about 11.2 cyc/deg. The lowest sampled spatial frequency was 2.24 cyc/deg, with the peripheral pixels at a distance of 10 pixels. (B) Output (screenshot) of the software. The bottom left picture shows ON outputs in red, OFF outputs in blue. On the right, the sum of all ON and OFF outputs is shown for different spatial frequencies. For the picture above, the sum of all ON and OFF responses were very similar.

