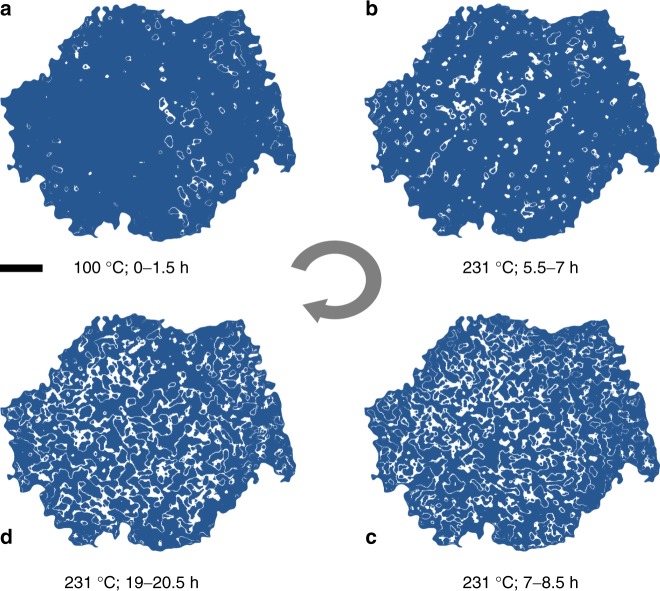
Fig. 2.
The development of the Ni reduction reaction front upon heating. The white pixels in the map are the pixels that have Ni K-edge position at 8341 ± 0.1 eV. The blue area in the figure is associated with local Ni K-edge position outside of the defined Ni K-edge energy window. a is the reaction front map over the particle after it is heated for up to 1.5 hours at 100 °C. b-d are the reaction front maps over the particle after it is heated at 231 °C for up to 7, 8.5, and 20.5 hours, respectively.The scale bar is 2 μm

