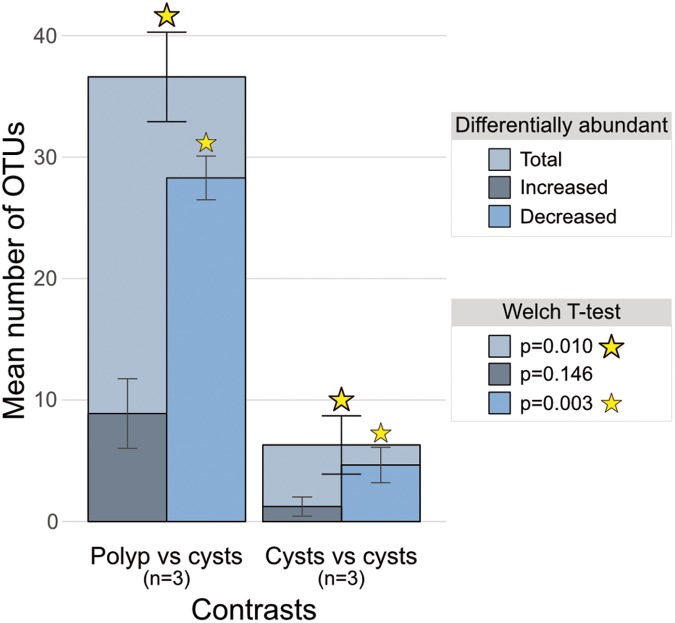
FIGURE 4.
Bar charts of mean total differentially abundant OTUs overlain with means of those increased and those decreased in polyp-to-cyst group contrasts and cyst-to-cyst group contrasts. The 3 polyp-to-cyst contrasts included: Polyps–Podocysts; Polyps–Excysts; and Polyps–isolated podocysts. The 3 cyst-cyst contrasts included: Podocyst–Excyst; Podocyst–isolated podocyst; and Excyst–isolated podocyst. The means between the 3 polyp vs. all cyst groups contrasts and the 3 cyst vs. cyst contrasts were found to be significantly different via the Welch t-test (p = 0.01).

