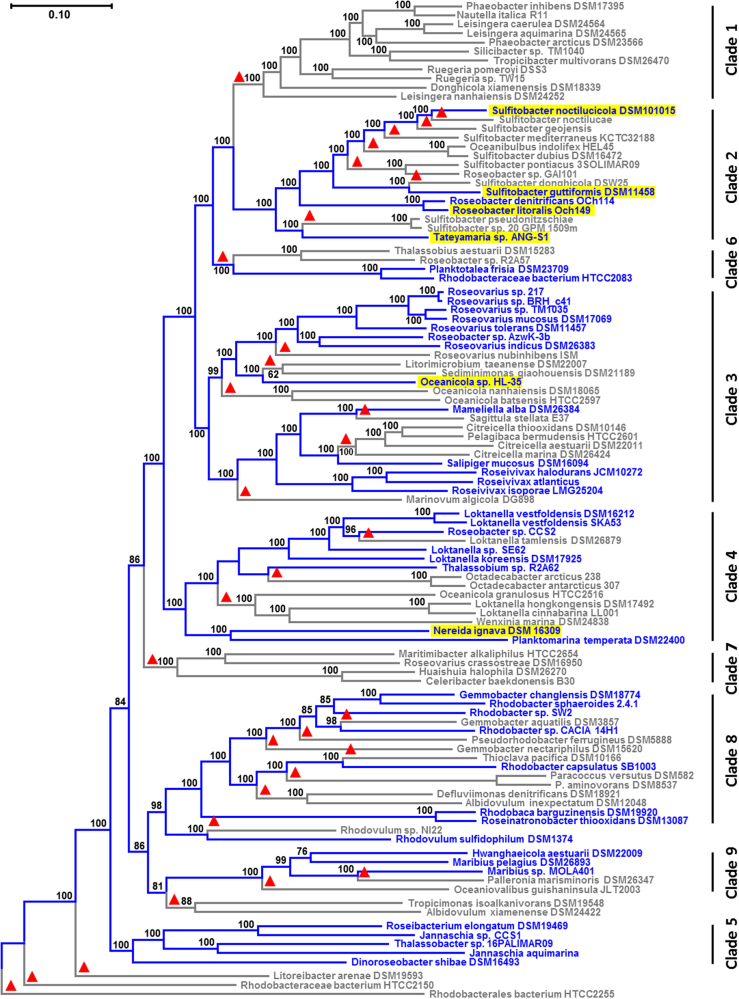
Fig. 1.
Phylogenomic tree of Rhodobacteraceae. Maximum-likelihood analysis of concatenated core-genome alignments with 194,215 amino acid positions from 105 sequenced genomes. The tree was inferred with ExaML under the optimal model and 100 bootstrap replicates conducted. Blue branches and labels display the extant distribution of photosynthetic strains, based on the assumption of (i) a photosynthetic ancestry of Rhodobacteraceae and (ii) a strict vertical evolution of the photosynthesis gene cluster (PGC). Red triangles mark independent PGC losses according to this “null-hypothesis”. Plasmid-located PGCs are highlighted in yellow. Rhodobacterales bacterium HTCC2255 was used as a close outgroup based on a preliminary analysis with more distantly related Alphaproteobacteria such as Neomegalonema perideroedes DSM 15528 (color figure online)

