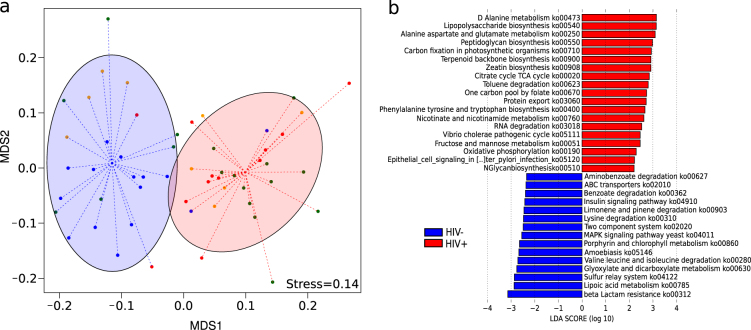
Fig. 1.
Comparison of the microbiota gene composition between HIV+ and HIV− groups from metagenomics. a NMDS analysis of the KO composition. Red ellipses represent a cluster mainly composed of HIV-infected subjects; blue ellipses represent a cluster mainly composed by uninfected subjects. The cluster configuration was validated using the ADONIS test (P value = 0.001). b Linear discriminative analysis (LDA) effect size LEfSe analysis of pathways (ko) between HIV-infected (red) and uninfected (blue) individuals. LDA scores (log10) for the most discriminative pathways in HIV− subjects were represented on the negative scale; LDA-positive scores indicated enriched pathways in HIV+ patients

