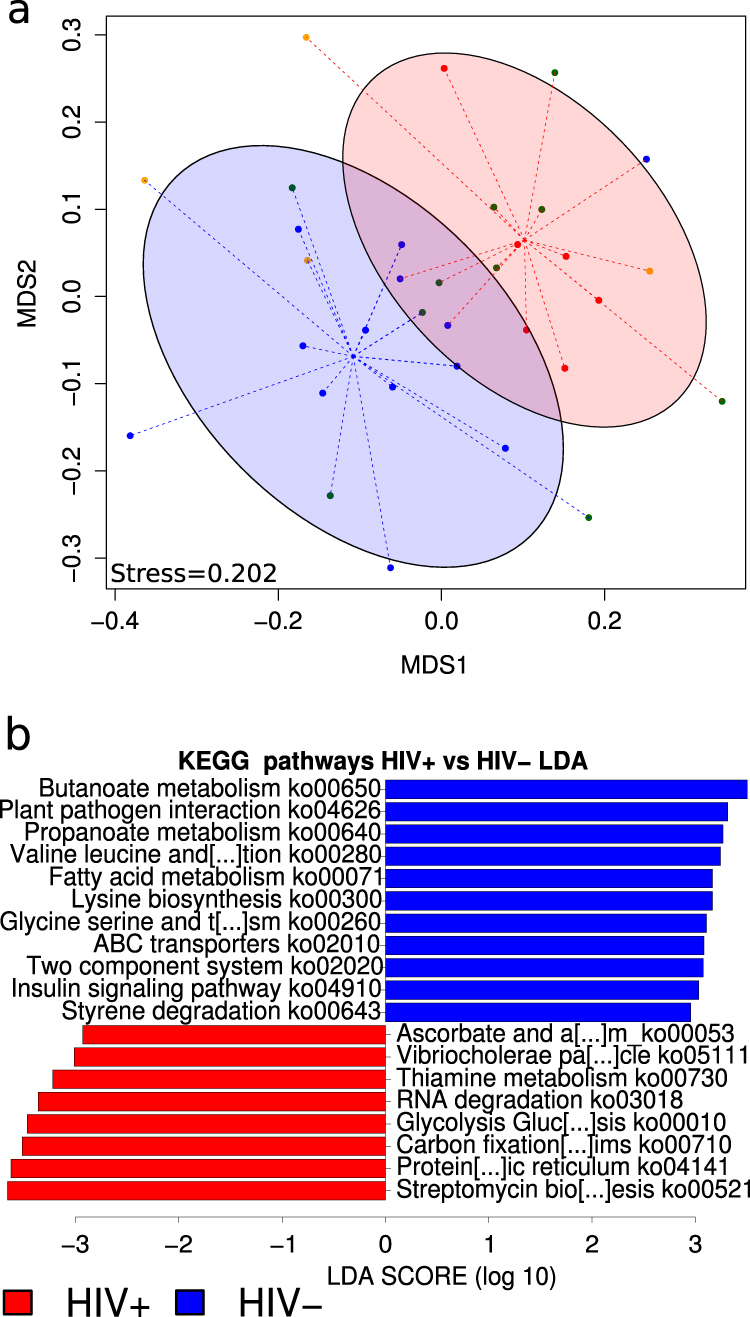
Fig. 3.

Comparison of microbiota gene composition between HIV-infected and uninfected subjects from metatranscriptomics. a NMDS analysis of the KO composition. b Linear discriminative analysis (LDA) effect size LEfSe analysis of pathways (ko) between HIV+ (red) and HIV− (blue) subjects. LDA scores (log10) for most discriminative pathways in HIV uninfected subjects are represented on the positive scale, whereas LDA-negative scores indicated enriched pathways in HIV-infected individuals
